Overfitting is a common problem data scientists face when building models with high complexity. It occurs when a model fits very well to the training data then subsequently performs poorly when tested on new data.
This issue most often arises when building deep neural network models, which is a statistical model that loosely represents the connectivity in the brain. These models tend to be complex since they can contain hundreds to thousands of parameters. Due to the high complexity, these models can pick up random noise as genuine trends, causing poor performance when making inferences on new data.
Overfitting is a big concern for any business that uses deep learning models to make predictions. For example, if a company wants to predict customer retention, an overfit model may represent random noise and outliers in the data as significant statistical trends. As a result, the model will perform poorly when used to predict if a customer will make a repeat purchase in the future, resulting in significant revenue loss for the company.
What Is Overfitting?
Several methods are commonly used to prevent overfitting in deep learning models. Lasso regression, also called L1 regularization, is a popular method for preventing overfitting in complex models like neural networks. L1 regularization works by adding a penalty term to the model. This penalty causes some of the coefficients in the model to go to zero, which you can interpret as discarding the model’s weights that are assigned random noise, outliers or any other statistically insignificant relationships found in the data.
In general, L1 regularization is useful for the feature selection step of the model building process. Specifically, you can use it to remove features that are not strong predictors. For example, when predicting customer retention, we may have access to features that are not very useful for making accurate predictions such as the customer’s name and email.
Another regularization method is ridge regression, which is also called L2 regularization. Ridge regression works by evenly shrinking the weights assigned to the features in the model. This method is useful when you have highly correlated features in your model. In the customer retention examples, highly correlated features may be dollars spent on last purchase or number of items purchased. These two features are highly correlated because the more items a customer purchases, the more money they spend. The presence of collinear features can also negatively impact model performance.
The Python library Keras makes building deep learning models easy. The deep learning library can be used to build models for classification, regression and unsupervised clustering tasks. Further, Keras makes applying L1 and L2 regularization methods to these statistical models easy as well. Both L1 and L2 regularization can be applied to deep learning models by specifying a parameter value in a single line of code.
Here, we will be using the Telco churn data to build a deep neural network model that predicts customer retention. The data contains information about a fictional telecom company.
Data Preparation
To start, let’s import the Pandas library and read the Teclo churn data into a Pandas data frame:
import pandas as pd
df = pd.read_csv('telco_churn.csv')
Next, let’s display the first five rows of data:
print(df.head())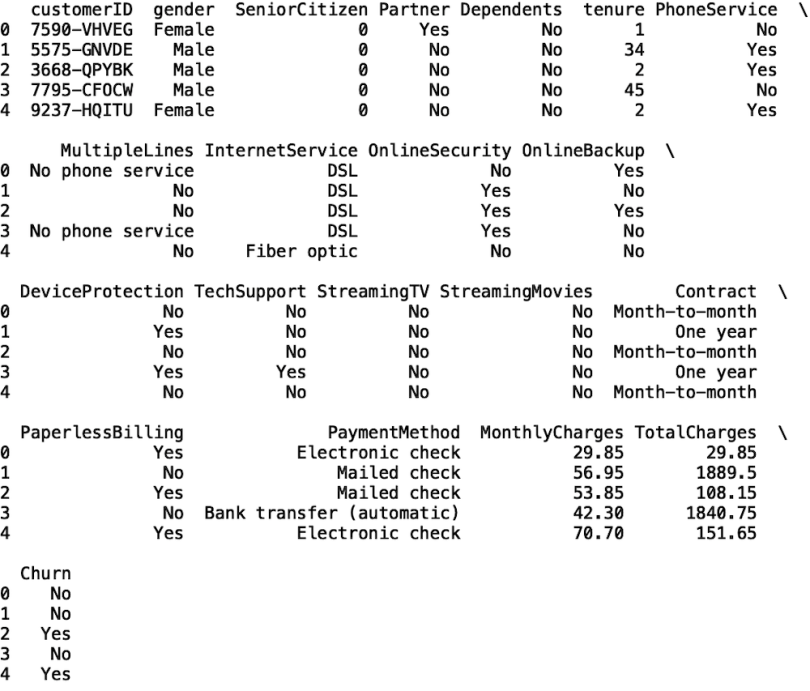
To build our churn model, we need to convert the churn column in our data to machine-readable values. Where churn has a value of “no,” we will assign a label “zero,” and where churn has a value of “yes,” we will assign the label “one.”
Let’s import the Numpy package and use the where() method to label our data:
import numpy as np
df['Churn'] = np.where(df['Churn'] == 'Yes', 1, 0)
Many of the fields in the data are categorical. We need to convert these fields to categorical codes that are machine-readable so we can train our model. Let’s write a function that takes a list of categorical column names and modifies our data frame to include the categorical codes for each column:
def convert_categories(cat_list):
    for col in cat_list:
        df[col] = df[col].astype('category')
        df[f'{col}_cat'] = df[f'{col}_cat'].cat.codes
Let’s define our list of categorical columns:
category_list = [gender, 'Partner', 'Dependents', 'PhoneService',
'MultipleLines', 'InternetService',
                  'OnlineSecurity', 'OnlineBackup',
'DeviceProtection', 'TechSupport', 'StreamingTV',
                  'StreamingMovies', 'Contract', 'PaperlessBilling',
'PaymentMethod']
Next, let’s call our function with this list and display the first five rows of data:
convert_categories(category_list)

print(df.head())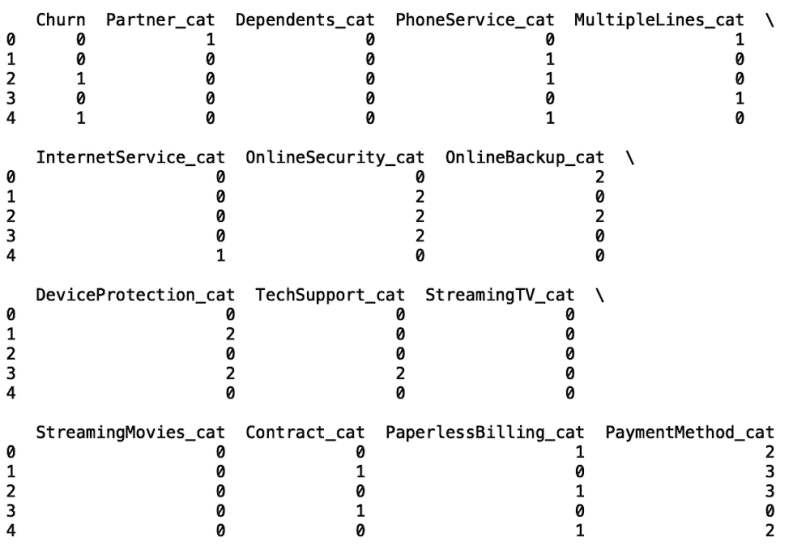
We can see that our data frame now contains categorical codes for each categorical column.
Next, let’s define our input and output:
X = df[['gender_cat', 'Partner_cat', 'Dependents_cat', 'PhoneService_cat', 'MultipleLines_cat', 'InternetService_cat',
                  'OnlineSecurity_cat', 'OnlineBackup_cat', 'DeviceProtection_cat', 'TechSupport_cat', 'StreamingTV_cat',
                  'StreamingMovies_cat', 'Contract_cat', 'PaperlessBilling_cat', 'PaymentMethod_cat','MonthlyCharges'
                  'TotalCharges', 'SeniorCitizen', 'tenure']]

y= df['Churn']
Next, let’s import the train/test split method for the model selection module in Scikit-learn. Let’s split our data for training and testing
from sklearn.model_selection import train_test_split

X_train, X_test_hold_out, y_train, y_test_hold_out =
train_test_split(X, y, test_size=0.33)
Neural Networks for Classification
To start building our classification neural network model, let’s import the dense layer class from the layers module in Keras. Let’s also import the sequential class from the models module in Keras and the accuracy method from the metric module in Scikit-learn:
from tensorflow.keras.layers import Dense
from tensorflow.keras.models import Sequential
from sklearn.metrics import accuracy_score
Now, let’s define and fit our model and fit the model to our training data. We’ll build a neural network with two hidden layers and 32 neurons. We’ll also use 20 epochs, which correspond to the number of passes through the training data.
Let’s define our model object.
model = Sequential()Next, let's add a dense layer using the add method. We need to pass in the number of features, which is the length of the columns list, and the input, which is a tuple with the length of the column list. We will also initialize weight values according to a normal distribution and using a rectified linear unit (ReLu) activation function. The activation function is what simulates neurons firing:
model.add(Dense(len(cols),input_shape=(len(cols),),
kernel_initializer='normal', activation='relu'))
Next, we will add two hidden layers using the add method. These layers will have 32 neurons and also use a ReLu activation function:
model.add(Dense(32, activation='relu'))
model.add(Dense(32, activation='relu'))
We then need to add the output layer, which will have one neuron and a softmax activation function. This will allow our model to output class probabilities for predicting whether a customer will churn:
model.add(Dense(1, activation='softmax'))
model.compile(optimizer = 'adam',loss='binary_crossentropy', metrics
=['accuracy'])
model.fit(X_train, y_train,epochs =20)
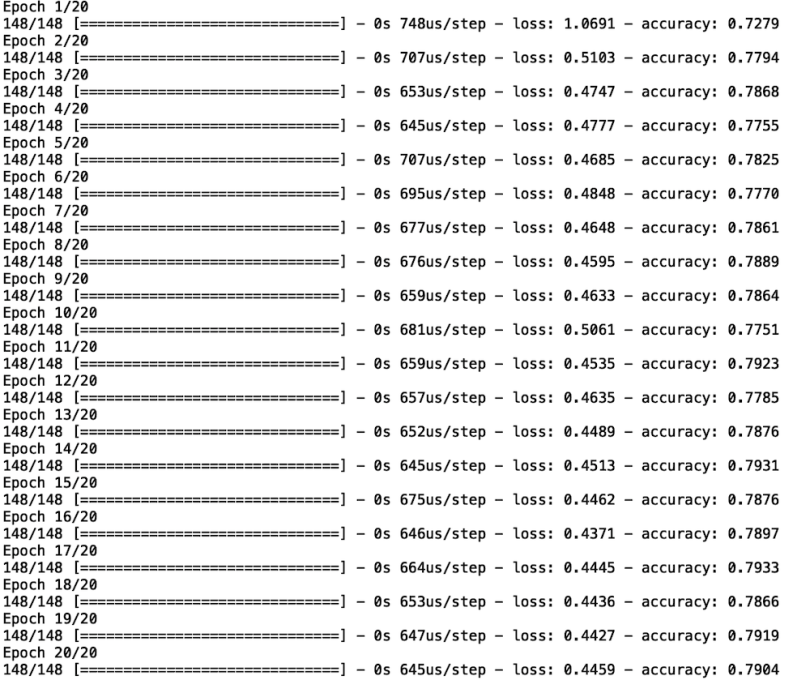
We can see that, with each epoch, the loss generally decreases and the accuracy increases.
Now let’s generate predictions. The prediction output is a list of probability of churn corresponding to each input in the test data. We can convert the predictions to binary scores, where probability values greater than 50 percent (0.5) will be classified as churn, with a label of one. Otherwise, it will be classified with a label of zero, which corresponds to the customer staying with the company:
y_pred = model.predict(X_test)
y_pred = np.where(y_pred > 0.5, 1, 0)
Let’s also calculate the accuracy of our model:
print("Accuracy: ", accuracy_score(y_pred, y_test))
We see that our model accuracy is 77.9 percent, which is pretty good. Let’s see if we can improve performance with lasso regression.
Lasso Regression (L1 Regularization)
Keras makes implementing lasso regression with neural network models straightforward. The regularizers package in Keras has a method that we can call, named l1, in the layers of our neural network. This will apply penalty terms to the weights in the layers which will help prevent overfitting.
Typically, lasso regression sends insignificant feature weights to zero, allowing the model to include the most important features for making accurate predictions. Let’s import the regularizer package from Keras:
from tensorflow.keras import regularizersNext, let’s define a new model object, which we will call model_lasso.
model_lasso = Sequential()In the input layer, we will pass in a value for the kernel_regularizer using the l1 method from the regularizers package:
model_lasso.add(Dense(len(cols),input_shape=(len(cols),),
kernel_initializer='normal', activation='relu', kernel_regularizer =
regularizers.l1(1e-6)))
The next few lines of code are identical to our initial neural network model. The only difference is we are work with the model object model_lasso, instead of model:
model_lasso.add(Dense(32, activation='relu'))
model_lasso.add(Dense(32, activation='relu'))
model_lasso.add(Dense(1, activation='sigmoid'))
model_lasso.compile(optimizer = 'adam',loss='binary_crossentropy',
metrics =['accuracy'])
model_lasso.fit(X_train, y_train,epochs =20)

y_pred = model_lasso.predict(X_test)
y_pred = np.where(y_pred > 0.5, 1, 0)
print("Accuracy With Lasso: ", accuracy_score(y_pred, y_test))

Lasso regression is a great option if you have many features in your model that do not contribute positively to performance. For that reason, it’s useful as a feature selection tool.
Ridge Regression (L2)
Apply ridge regression to neural network models is also easy in Keras. Similar to the lasso method, we simply need to call a method name l2 in the layers of our neural network. The difference between lasso and ridge is that the former tends to discard insignificant values altogether, whereas ridge simply decreases the magnitude of the weights in our neural network across all features. Let’s define a new model object called model_ridge:
model_ridge = Sequential()And in the input layer, we will use the l2 method:
model_ridge.add(Dense(len(cols),input_shape=(len(cols),),
kernel_initializer='normal', activation='relu', kernel_regularizer =
regularizers.l2(1e-6)))
The rest is similar to what we did above:
model_ridge.add(Dense(32, activation='relu'))
model_ridge.add(Dense(32, activation='relu'))
model_ridge.add(Dense(1, activation='sigmoid'))
model_ridge.compile(optimizer = 'adam',loss='binary_crossentropy', metrics =['accuracy'])
model_ridge.fit(X_train, y_train,epochs =20)

y_pred = model_lasso.predict(X_test)
y_pred = np.where(y_pred > 0.5, 1, 0)
print("Accuracy With Ridge: ", accuracy_score(y_pred, y_test))
With ridge, the accuracy is slightly better than the first neural network we built as well as the neural network with lasso. Choosing the best regularization method to use depends on the use case. If using all of the input features in your model is important, ridge regression may be a better choice for regularization. This may be the case where certain features need to be kept for training our model.
For example, a weak feature may still be useful as a lever to a company.They may want to see how model predictions change as the value of the weak feature changes even if it does not strongly contribute to performance.
The code from this post is available on GitHub.
Conclusions
Preventing models from overfitting is important for data science teams that use complex models like neural networks. Overfitting can have a significant impact on a company’s revenue if not taken into consideration. Models with many parameters, like neural networks, are especially prone to overfitting and can give researchers a false sense of good model performance.
Typically, overfit models show strong performance when tested on current data and can perform very poorly once the model is presented with new data. For example, in the case of churn, an overfit model may be able to predict with high accuracy if a customer will not make a repeat purchase. When new customer data is presented, however, the overfit model would then perform poorly and no longer be able to predict customer churn. This inaccuracy can cause companies to waste a significant amount of money and resources targeting the wrong customers with ads and promotions, disregarding customers who are actually likely to churn. For this reason, having a good understanding of how to use lasso and ridge regression for preventing the overfitting of complex models is an important skill for every data scientist.