Lists and arrays are two of the most widely used data structures in Python. A list in Python is simply a collection of objects. These objects can be integers, floating point numbers, strings, boolean values or even other data structures like dictionaries. An array, specifically a Python NumPy array, is similar to a Python list. The main difference is that NumPy arrays are much faster and have strict requirements on the homogeneity of the objects. For example, a NumPy array of strings can only contain strings and no other data types, but a Python list can contain a mixture of strings, numbers, booleans and other objects. Because operations like calculating mean or sum are much faster on NumPy arrays, these data structures are more common in contexts where speed performance is a priority.
Both lists and NumPy arrays have a wide array of built-in methods for performing a variety of tasks including sorting, finding min/max, truncating, appending, concatenating and much more.
Lists can also define other data structures such as dictionaries, which have applications in both software engineering and data science. For example, lists can generate dictionaries, which can be converted to JSON files. Software engineers commonly use these file types.
Dictionaries can also be converted into data frames, which data scientists often use. Even more, Python lists allow you to easily construct a variety of data frames useful for many data tasks. This includes augmenting existing data tables with new fields, calculating new data fields using constructed lists, performing exploratory data analysis on data accessed through an API, and much more. Having a thorough understanding of Python lists and NumPy arrays opens the door to many useful data tasks.
Lists and arrays are frequently used for tasks such as generating synthetic data. In many cases, data science teams have limited access to real data. When building software that relies on data ETL and machine learning, synthetic data is often the only option for building an application prototype. Python enables you to generate synthetic lists such as names, states, heights, professions, and any other categorical value that can be represented as a string. Further, it can also generate numerical values such as populations, incomes and transaction amounts. Simple feature engineering is also straightforward with list comprehension in Python. All in all, both lists and arrays offer many useful methods for manipulating and generating data.
Here, we will survey some of the most common methods and data structures that use lists and arrays. This should give the beginner software engineer or data scientist a solid foundation for using lists for data manipulation in Python.
Python Lists vs Arrays: How to Create Python Lists and Arrays
- A list in Python is simply a collection of objects. These objects can be integers, floating point numbers, strings, boolean values or even other data structures like dictionaries.
- An array, specifically a Python NumPy array, is similar to a Python list. The main difference is that NumPy arrays are much faster and have strict requirements on the homogeneity of the objects.
- Both lists and NumPy arrays have a wide array of built-in methods for performing a variety of tasks including sorting, finding min/max, truncating, appending, concatenating and much more.
How to Create a List in Python
Constructing a list in Python is very straightforward. You can construct a list of strings, floating point values, integers and boolean values. A Python list of strings is a list of values that correspond to a sequence of unicode characters. A list of floating points contains values that represent real numbers. A list of integers contains whole number values that may be positive, negative or zero. Finally, a boolean list is a list of true/false values. You can also construct a list of mixed types.
Let’s start by constructing a string list containing the companies Facebook, Amazon, Apple, Netflix and Google:
tech_company_names = ['Facebook', 'Apple', 'Amazon', 'Netflix', 'Google']Let’s also construct a list of integers that represent the number of employees at each of these companies in 2021. The order in our integer list will be the same as the order in our company name list. For example, in our company name list, “Facebook” is the value of the first element and in our employee list, and 58,604 is the number of employees at Facebook.
tech_company_employees = [58604, 147000, 950000, 11300, 135301]Next, let’s construct a list of floats that correspond to the revenue, in USD in billions, for each company in 2021:
tech_company_revenue = [117, 378, 470, 30, 257]Finally, let’s create a boolean list. We will use something called list comprehension to construct our list of boolean values. List comprehension is an easy and useful way to construct new lists based on the values in other lists. The structure of list comprehension generally looks like the following:
list = [expression for element in iterable]An expression can simply be the element in the iterable itself or some transformation of the element, such as checking the truth value of a condition. This is what we will do to create the list of booleans. This list will be based on the values in our tech company employees lists. It will have a value of true if there are more than 60,000 employees and false otherwise:
tech_company_employee_bool = [x > 60000 for x in
tech_company_employees ]
This will create the following list:
[False, True, True, False, True]Constructing a list of mixed types is also possible. Suppose we have the company name, revenue, number of employees and boolean values based on number of employees. Let’s consider this list of mixed type values for Microsoft:
new_company_info = ['Microsoft', 163000, 877, True]We can use the append method to update each list. If we print the updated lists, we see that the new values have been added:
print('Company: ', tech_company_names)
print('Employees: ', tech_company_employees)
print("Revenue: ", tech_company_revenue)
print("Employee_threshold: ", tech_company_employee_bool)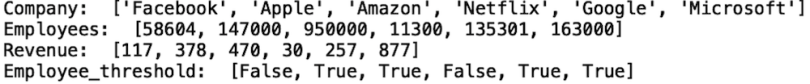
Python lists also are equipped with a variety of useful methods. For example, we can sort the list of companies (alphabetically) and number of employees (in increasing order):
tech_company_names.sort()
tech_company_employees.sort()
This modifies our lists in place to the following:

Note that this changes the order of these lists so they no longer match. A safer choice is using the built-in Python method sorted, which returns a sorted list that we can store in a new variable instead of modifying the old list.
sort_company = sorted(tech_company_names)
sort_employee = sorted(tech_company_employees)

print(sort_company)
print(sort_employee)
How to Create an Array in Python With NumPy
NumPy is a Python package useful for generating arrays, which have many distinctions from Python lists. The biggest difference is NumPy arrays use fewer resources than Python lists, which becomes important when storing a large amount of data. If you’re working with thousands of elements, Python lists will be fine for most purposes. When the number of elements in a list approaches millions or billions, however, NumPy arrays are preferable.
NumPy is also useful for generating synthetic data. For example, suppose in our tech company data example, we are missing values for net income, where the net income is total sales minus the cost of goods, taxes and interest. We’d like to impute these values in some way. Further, we’d like to sample these imputed values from a normal distribution. Let’s create a NumPy array that contains the list of net incomes for each company.
To proceed, let’s import the NumPy package:
import numpy as np In order to generate our sample, we need a value for the mean net income and the standard deviation in net income. Let’s make a simple assumption that the average net income across companies is $80 billion with a standard deviation of $40 billion. We will call the variables for mean and standard deviation mu and sigma, respectively:
mu, sigma = 80, 40We also need to specify the number of values we would like to generate. We can simply store the length of our tech company lists in a new variable we’ll call n_values:
n_values = len(tech_company_names)We also should specify a random seed value to make sure our results are reproducible:
np.random.seed(21)To generate our array, we’ll use the normal method in the NumPy random module. We’ll pass the parameter values for mean (mu), standard deviation (sigma) and number of values (n_values) into the normal method and store the result in a variable called net_income:
net_income_normal = np.random.normal(mu, sigma, n_values)
print(net_income_normal)
Here, we generated synthetic values for net incomes for Facebook ($77 billion), Apple ($75 billion), Amazon ($121 billion), Netflix ($29 billion), Google ($109 billion) and Microsoft ($11 billion). Since these numbers are synthetic and we’re using made-up values for aggregate statistics to impute values for all companies, they’re not very realistic.
An even more accurate way to generate these synthetic values is to work from a unique normal distribution for each company using each company’s mean net income and standard deviations in net income if accessible. For this example, our simple approach of assuming we have access to the average and standard deviation across all companies is enough.
For this example, we assumed that the distribution in net income is normal (or shaped like a bell curve). Another common pattern is the fat-tailed distribution, which occurs when a distribution contains a significant number of extreme positive or negative values. This is also called skewness. We can generate a list of synthetic values for net income from a fat-tailed distribution using the gumbel method in NumPy:
np.random.seed(64)
net_income_fat_tail = np.random.gumbel(mu, sigma, n_values)
print(net_income_fat_tail)
Again, it’s worth noting here that, although these values aren’t very realistic, they can easily be improved either by using actual aggregate statistic values and generating a distribution for each company. With the right domain expertise, these methods can generate high-quality, realistic synthetic data.
Using Python Lists to Construct Dictionaries, JSON Files, Data Frames and CSV Files
With the lists we’ve generated, we can now construct a Python dictionary, which is a useful way to store our lists in key value pairs. We have a list for company name, number of employees, revenue, revenue threshold booleans, normally distributed net income, and fat-tail distributed net income. Let’s create a dictionary mapping appropriated named keys for each of these to our lists:
company_data_dict = {'company_name': tech_company_names,
                     'number_of_employees': tech_company_employees,
                     'company_revenue': tech_company_revenue,
                     'employee_threshold': tech_company_employee_bool,
                     'net_income_normal': list(net_income_normal),
                     'net_income_fat_tail': list(net_income_fat_tail)}

print(company_data_dict)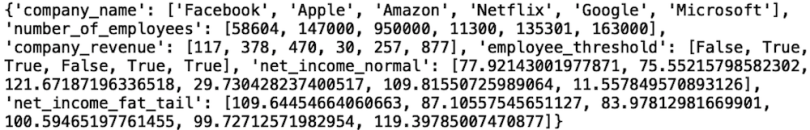
We see that, in this data structure we have keys, which are unique strings, or the names we give to each list, and the corresponding list. We can easily convert this dictionary into a JSON file with the following logic:
import json
with open('company_data.json', 'w') as fp:
    json.dump(company_data_dict, fp)
And we can read our JSON file and print the results:
f = open('company_data.json')
company_json = json.loads(f.read())
print(company_json)
We can also easily convert Python dictionaries to a Pandas data frame using the Pandas data frame constructor:
import pandas as pd
company_df = pd.DataFrame(company_data_dict)
print(company_df)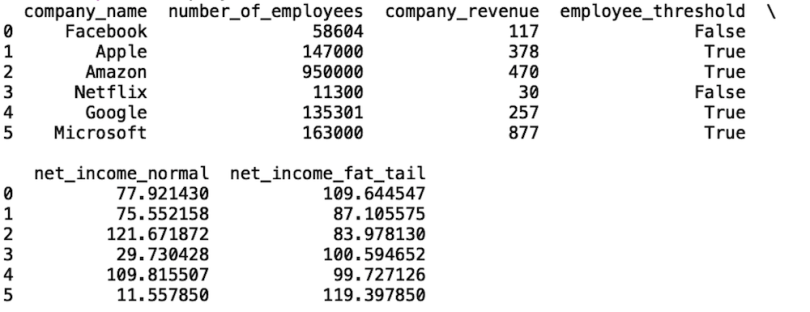
We can also use Pandas to write this data frame to a CSV file using the to_csv method:
company_df.to_csv("comapany_csv_file.csv", index=False)And we can use the read_csv method to read in our file:
read_company_df = pd.read_csv("comapany_csv_file.csv")And display our data:
print(read_company_df)
We see that with a single line of code we were able to generate a Pandas data frame using the lists and dictionary we created earlier.
The code in this post is available on GitHub.
Experimenting With Python Lists and NumPy Arrays
Constructing lists and arrays in Python is useful for a variety of tasks. Python allows you to easily create and manipulate lists for strings, bools, floats, and integers. Further, list comprehension allows you to create new lists based on the values in another list in a readable and concise way.
NumPy arrays are a more resource-efficient alternative to lists that also come equipped with tools for performing complex mathematical operations and generating synthetic data. Both of these iterables can be used to construct more complex data structures such as dictionaries and data frames. Further, it is straightforward to create json and csv files from these data structures that have been created from lists. Having a good understanding of the tools available for generating and manipulating lists and arrays in Python is essential for every engineer and data scientist.