Have you ever wondered what the difference is between standard deviation and standard error?
Difference Between Standard Deviation and Standard Error
- Standard Deviation: Measures the variability of the data in relation to the mean. The closer it is to zero, the closer to the mean the values are in the data set.
- Standard Error: Measures the variability of means calculated from various data samples. In essence, it is the standard deviation of sample means.
If you haven’t, here’s why you should care.
What Is Standard Deviation?
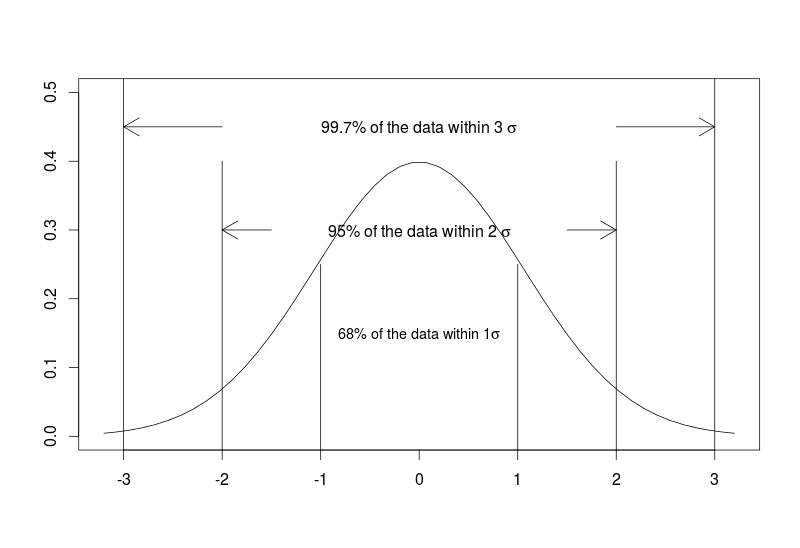
Standard deviation measures the dispersion — variability — of the data in relation to the mean. In other words, the closer to zero the standard deviation is, the closer to the mean the values are in the studied data set. A normal distribution gives us valuable information in terms of the percentage of data within one, two and three standard deviations from the mean.
Let’s use R to generate some random data:
#generating some random data
set.seed(20151204)
#computing the standard deviation
x<-rnorm(10)
sd(x)
# result: 1.14415
Now, let’s generate a normally distributed graph:
#generating the normally distributed graph with description of segments
plot(seq(-3.2,3.2,length=50),dnorm(seq(-3,3,length=50),0,1),type="l",xlab="",ylab="",ylim=c(0,0.5))
segments(x0 = c(-3,3),y0 = c(-1,-1),x1 = c(-3,3),y1=c(1,1))
text(x=0,y=0.45,labels = expression("99.7% of the data within 3" ~ sigma))
arrows(x0=c(-2,2),y0=c(0.45,0.45),x1=c(-3,3),y1=c(0.45,0.45))
segments(x0 = c(-2,2),y0 = c(-1,-1),x1 = c(-2,2),y1=c(0.4,0.4))
text(x=0,y=0.3,labels = expression("95% of the data within 2" ~ sigma))
arrows(x0=c(-1.5,1.5),y0=c(0.3,0.3),x1=c(-2,2),y1=c(0.3,0.3))
segments(x0 = c(-1,1),y0 = c(-1,-1),x1 = c(-1,1),y1=c(0.25,0.25))
text(x=0,y=0.15,labels = expression("68% of the data within 1" * sigma),cex=0.9)
When we calculate the mean of a particular sample, we want to draw conclusions about the larger population from which the sample comes. We usually collect representative sample data because we’re limited in terms of resources for collecting information about the whole population. So, we’ll use it as an estimate of the whole population mean.
What Is Standard Error?
Of course, there will be different means for different samples from the same population. The standard deviation of these various sample means is the standard error. In short, standard error measures the precision of the estimate of the sample mean.

The standard error is strictly dependent on the sample size. As a result, the standard error falls as the sample size increases. If you think about it, the bigger the sample, the closer the sample mean is to the population mean, so the closer the estimate is to the actual value.
R code for computing standard error below:
#computation of the standard error of the mean
sem<-sd(x)/sqrt(length(x))
Standard Deviation vs. Standard Error
If you need to draw conclusions about the spread and variability of the data, use standard deviation.
If you’re interested in finding how precise the sample mean is or you’re testing the differences between two means, then standard error is your metric.
Frequently Asked Questions
What is the key difference between standard deviation and standard error?
Standard deviation and standard error measure different variables. While standard deviation measures the variability of data relative to the mean, standard error measures the variability of the means of various data samples.
When should I use standard deviation vs. standard error?
Standard deviation is best used for measuring the spread of a particular data set, calculating how far away data points are from the mean. Standard error is more ideal for comparing two means, particularly for assessing how close a sample mean is to a population mean.
How does sample size affect standard error?
A larger sample size decreases the standard error and vice versa. This is because a larger sample is more reflective of the entire population, so a sample mean will more accurately estimate the population mean.