

Cluster analysis is a data analysis method that clusters (or groups) objects that are closely associated within a given data set. When performing cluster analysis, we assign characteristics (or properties) to each group. Then we create what we call clusters based on those shared properties. Thus, clustering is a process that organizes items into groups using unsupervised machine learning algorithms.
What Is Cluster Analysis?
Cluster analysis is an exploratory data analysis technique used to group together data points that are similar to each other within a data set. This method is ideal for identifying patterns and detecting outliers among unlabeled data.
Cluster analysis is a useful and straightforward tool for understanding data patterns. The main goal of clustering is to identify the clusters and group them accordingly. We can also use cluster analysis to identify anomalies or outliers, which are cases that stand out from the rest of the data. We use anomalies mostly to identify areas or cases that need further investigation. For example, banks use anomaly detection to fight fraud.
When Is Cluster Analysis Useful?
Cluster analysis helps us understand data and detect patterns. In certain cases, it provides a great starting point for further analysis. In other cases, it can glean in-depth insights from the data. Here are some cases when cluster analysis is more appropriate than other methods like standard deviation or correlation.
When Should You Use Cluster Analysis?
- If you have large and unstructured data sets, it can be expensive and time-consuming to label groups manually. In this case, cluster analysis provides the best solution to divide your data into groups.
- When you don’t know the number of clusters in advance, cluster analysis can provide the first insight into groups that are available in your data set.
- When you need to detect outliers in your data, cluster analysis is an effective method compared to traditional outlier detection methods, such as standard deviation.
- Cluster analysis can help you detect anomalies. While outliers are observations distant from the mean, they don’t necessarily represent abnormalities. On the other hand, anomalies relate to identifying rare events or observations that deviate greatly from the mean.
Applications of Cluster Analysis
Cluster analysis has applications in many disparate industries and fields. Here’s a list of some disciplines that make use of this methodology.
- Marketing: Cluster analysis is popular in marketing, especially in customer segmentation. This method of analysis helps to both target customer segments and perform sales analysis by groups.
- Business Operations: Businesses can optimize their processes and reduce costs by analyzing clusters and identifying similarities and differences between data points. For example, you can identify patterns in customer data and improve customer support processes for a particular group that may require special attention.
- Earth Observation: Using a clustering algorithm, you can create a pixel mask for objects in an image. For example, you can use image segmentation to classify vegetation or built-up areas in a satellite image.
- Data Science: We can use cluster analysis for predictive analytics. By applying machine learning techniques to clusters, we can create predictive models to make inferences about a particular data set.
- Healthcare: Healthcare researchers can use cluster analysis to group together patients for clinical trials. Cluster analysis is also useful for identifying patients with similar behaviors and symptoms, improving diagnosis and treatment plans.
- Finance: Financial institutions can use cluster analysis to categorize customers according to risk levels based on factors like debt, credit scores and bank balances. They can then factor this into their decisions when approving individuals for loans and insurance.
- Education: Tracking student progress, educators can use cluster analysis to group students according to achievements, grades and other factors. This can help them identify underperforming students and give additional support.
- Real Estate: Clustering analysis can be used to group houses for sale based on variables like location, price and property type. Realtors can use these insights to detect market trends and predict the growth or decline of neighborhoods.
Types of Clustering Methods
There are various ways to conduct cluster analysis, but these are the main types of clustering data professionals need to know.
Centroid-Based Clustering
Centroid-based clustering calculates clusters based on a central point which may or may not be part of the data set. For centroid-based clustering, you can use the K-means clustering algorithm, which divides the data set into k clusters. Data points belong to the cluster with the nearest mean or cluster point.
Density-Based Clustering
Density-based clustering deals with the density of the data points. The clusters are tied to a threshold — a given number that indicates the minimum number of points in a given cluster radius. Density-based clustering is an effective way to identify noise and separate it from the clusters. The most widely used density-based clustering algorithm is density-based spatial clustering of applications with noise (DBSCAN).
Model-Based Clustering
Model-based clustering assumes that data points in each cluster follow a specific probability distribution, representing the data as a finite combination of statistical models. This method is useful when outliers are present, the data is noisy or the underlying distribution is unknown. A prominent example of a model-based clustering algorithm is the Gaussian mixture model.
Hierarchical Clustering
Hierarchical clustering arranges data into a tree of clusters to identify patterns, merging or splitting clusters as needed. This type of clustering can be further broken down into two main types, with divisive clustering taking a top-down approach and agglomerative clustering (more on this to come) taking a bottom-up approach.
Distribution-Based Clustering
Similarly to model-based clustering, distribution-based clustering assumes data points in each cluster follow a specific probability distribution and are created through a mixture of statistical models. Unlike model-based clustering, distribution-based clustering goes one step further and clusters data points based on how likely they belong to a particular probability distribution.
Fuzzy Clustering
Also known as soft clustering, fuzzy clustering enables data points to belong to multiple clusters. This approach assigns a probability score to each data point for each cluster, allowing it to belong to different clusters to varying degrees. Fuzzy clustering helps address situations where it’s more unclear as to which cluster each data point belongs.
Cluster Analysis Algorithms
In addition to the types of clustering, here are some of the most common algorithms used to perform cluster analysis.
K-Means
The k-means algorithm calculates the average of all the data points in a cluster to determine a centroid point. It aims to reduce the variance of data points within a cluster as much as possible by minimizing the distance of each point from the centroid point. K-means must then measure the Euclidean distance between each point in the data set to organize data into clusters where the data points are closest to each other.
K-Medoids
Like k-means, the k-medoids algorithm seeks to identify a central point of a data cluster. However, it chooses an actual point to represent the center of the cluster instead of calculating the centroid point. K-medoids also measures distance in multiple dimensions rather than using Euclidean distance. While less popular than k-means, k-medoids is better suited to handle data noise and outliers.
DBSCAN
Short for density-based spatial clustering of applications with noise, the DBSCAN algorithm groups data into clusters based on their density, or how closely packed they are to each other. For this reason, DBSCAN excels at identifying arbitrarily shaped clusters and removing noise and outliers from data sets.
Gaussian Mixture Model
Gaussian mixture models organize data points into clusters based on probabilities. This approach represents each cluster as a Gaussian distribution and determines the probability of each data point belonging to each cluster based on their distance from each Gaussian distribution. Gaussian mixture models are then considered to be soft clustering algorithms since their clusters are less rigid and can take on different shapes as opposed to those created by k-means.
Agglomerative Hierarchy
As previously mentioned, agglomerative clustering takes a bottom-up approach. This means that the agglomerative hierarchy clustering algorithm considers each data point to be its own cluster, merging the clusters nearest to each other until a single cluster is left. This contrasts with divisive clustering, which starts with a single cluster and divides the data points furthest from each other into different clusters.
Fuzzy C-Means
The fuzzy c-means clustering algorithm assigns each data point a probability score for belonging to each cluster. To determine this, it calculates the distance of a data point from the centroid of each cluster. This reveals how likely a data point belongs to a cluster, allowing data points to belong to clusters to varying degrees.
How to Measure Clusters
To determine the quality of the clustering, intracluster distance and intercluster distance need to be measured:
- Intracluster Distance: The distance between data points within a cluster. The stronger the clustering, the smaller the intracluster distance will be.
- Intercluster Distance: The distance between data points in separate clusters. The stronger the clustering, the larger the intercluster distance will be.
It’s essential to calculate both intracluster distance and intercluster distance, so you have a better idea of your clustering’s effectiveness. Remember, high-quality clustering results in high intra-cluster similarity and low inter-cluster similarity.
Example of Cluster Analysis
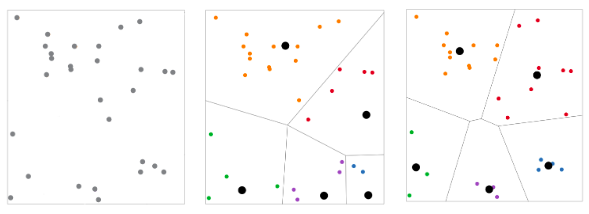
The following example shows you how to use a centroid-based clustering algorithm to cluster 30 different points into five groups. You can plot points on a two-dimensional graph, as shown in the graphs below.
On the left, we have a random distribution of the 30 points. The first iteration of the k-means clustering divides the points into five groups, with each cluster represented by a different color, as shown in the center graph.
The algorithm will then iteratively move the points from one cluster to another until the points are grouped optimally. The end result will be five distinct clusters, as shown in the graph on the right.
Frequently Asked Questions
What is cluster analysis?
Cluster analysis is a data analysis technique that determines which data points within a data set are most similar to each other, and groups them together based on those similarities. This makes it a useful method for detecting patterns and outliers in unlabeled data.
What is an example of using cluster analysis?
A common example of cluster analysis is marketers using the technique to develop customer segments. They can group customers according to variables like purchasing habits or demographic traits and then tailor their marketing strategies to target particular groups of individuals with similar characteristics.
What are the types of cluster analysis?
The main types of cluster analysis are centroid-based, density-based, model-based, hierarchical, distribution-based and fuzzy.
How does cluster analysis work?
Cluster analysis works by using unsupervised machine learning algorithms to organize data points into groups, or clusters, based on shared characteristics or proximity in feature space.
What are common types of clustering methods?
Key clustering methods include centroid-based, density-based, model-based, hierarchical, distribution-based and fuzzy clustering.
Which clustering algorithms are most widely used?
Popular algorithms include k-means, k-medoids, DBSCAN, Gaussian mixture models, agglomerative hierarchy and fuzzy c-means.


