

What Is Clustering?
Clustering is the process of separating different parts of data based on common characteristics. Disparate industries including retail, finance and healthcare use clustering techniques for various analytical tasks. In retail, clustering can help identify distinct consumer populations, which can then allow a company to create targeted advertising based on consumer demographics that may be too complicated to inspect manually. In finance, clustering can detect different forms of illegal market activity like orderbook spoofing in which traders deceitfully place large orders to pressure other traders into buying or selling an asset. In healthcare, clustering methods have been used to figure out patient cost patterns, early onset neurological disorders and cancer gene expression.
Python offers many useful tools for performing cluster analysis. The best tool to use depends on the problem at hand and the type of data available. There are three widely used techniques for how to form clusters in Python: K-means clustering, Gaussian mixture models and spectral clustering. For relatively low-dimensional tasks (several dozen inputs at most) such as identifying distinct consumer populations, K-means clustering is a great choice. For more complicated tasks such as illegal market activity detection, a more robust and flexible model such as a Guassian mixture model will be better suited. Finally, for high-dimensional problems with potentially thousands of inputs, spectral clustering is the best option.
In addition to selecting an algorithm suited to the problem, you also need to have a way to evaluate how well these Python clustering algorithms perform. Typically, average within-cluster-distance from the center is used to evaluate model performance. Specifically, the average distance of each observation from the cluster center, called the centroid, is used to measure the compactness of a cluster. This makes sense because a good Python clustering algorithm should generate groups of data that are tightly packed together. The closer the data points are to one another within a Python cluster, the better the results of the algorithm. The sum within cluster distance plotted against the number of clusters used is a common way to evaluate performance.
For our purposes, we will be performing customer segmentation analysis on the mall customer segmentation data.
Data Clustering Techniques in Python
- K-means clustering
- Gaussian mixture models
- Spectral clustering
Reading in Data
Let’s start by reading our data into a Pandas data frame:
import pandas as pd

df = pd.read_csv("Mall_Customers.csv")

print(df.head())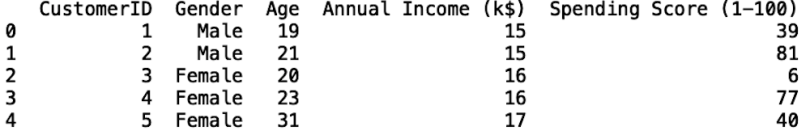
We see that our data is pretty simple. It contains a column with customer IDs, gender, age, income, and a column that designates spending score on a scale of one to 100. The goal of our Python clustering exercise will be to generate unique groups of customers, where each member of that group is more similar to each other than to members of the other groups.
K-Means Clustering in Python
K-means clustering in Python is a type of unsupervised machine learning, which means that the algorithm only trains on inputs and no outputs. It works by finding the distinct groups of data (i.e., clusters) that are closest together. Specifically, it partitions the data into clusters in which each point falls into a cluster whose mean is closest to that data point.
Let’s import the K-means class from the clusters module in Scikit-learn:
from sklearn.clusters import KMeansNext, let’s define the inputs we will use for our K-means clustering algorithm. Let’s use age and spending score:
X = df[['Age', 'Spending Score (1-100)']].copy()The next thing we need to do is determine the number of Python clusters that we will use. We will use the elbow method, which plots the within-cluster-sum-of-squares (WCSS) versus the number of clusters. We need to define a for-loop that contains instances of the K-means class. This for-loop will iterate over cluster numbers one through 10. We will also initialize a list that we will use to append the WCSS values:
for i in range(1, 11):
    kmeans = KMeans(n_clusters=i, random_state=0)
    kmeans.fit(X)
We then append the WCSS values to our list. We access these values through the inertia attribute of the K-means object:
for i in range(1, 11):
    kmeans = KMeans(n_clusters=i, random_state=0)
    kmeans.fit(X)
    wcss.append(kmeans.intertia_)
Finally, we can plot the WCSS versus the number of clusters. First, let’s import Matplotlib and Seaborn, which will allow us to create and format data visualizations:
import matplotlib.pyplot as plt
import seaborn as sns
Let’s style the plots using Seaborn:
sns.set()Then plot the WCSS versus the clusters:
plt.plot(range(1, 11), wcss)Next, add a title:
plt.title('Selecting the Numbeer of Clusters using the Elbow Method')And finally, label the axes:
plt.xlabel('Clusters')
plt.ylabel('WCSS')
plt.show()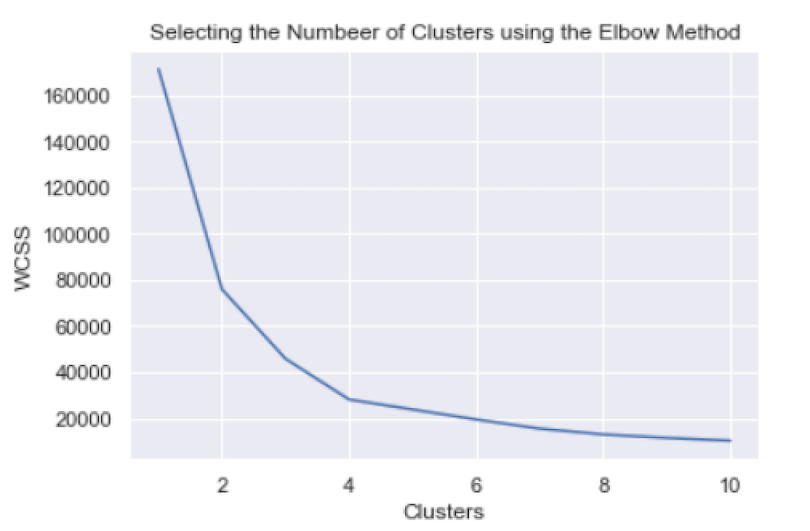
From this plot, we can see that four is the optimum number of clusters, as this is where the “elbow” of the curve appears.
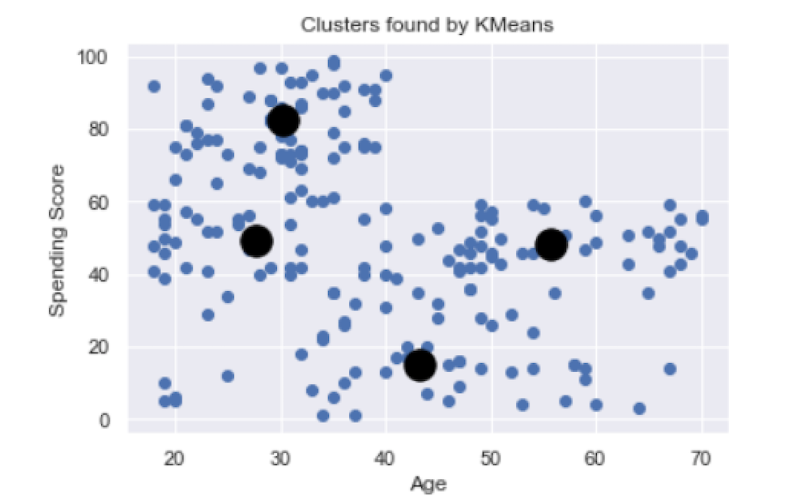
We can see that K-means found four clusters, which break down thusly:
-
Young customers with a moderate spending score.
-
Young customers with a high spending score.
-
Middle-aged customers with a low spending score.
-
Senior customers with a moderate spending score.
This type of information can be very useful to retail companies looking to target specific consumer demographics. For example, if most people with high spending scores are younger, the company can target those populations with advertisements and promotions.
Gaussian Mixture Model (GMM) in Python
This model assumes that clusters in Python can be modeled using a Gaussian distribution. Gaussian distributions, informally known as bell curves, are functions that describe many important things like population heights and weights.
These models are useful because Gaussian distributions have well-defined properties such as the mean, variance and covariance. The mean is just the average value of an input within a cluster. Variance measures the fluctuation in values for a single input. The covariance is a matrix of statistics describing how inputs are related to each other and, specifically, how they vary together.
Collectively, these parameters allow the GMM algorithm to create flexible identity clusters of complex shapes. Whereas K-means typically identifies spherically shaped clusters, GMM can more generally identify Python clusters of different shapes. This makes GMM more robust than K-means in practice.
Let’s start by importing the GMM package from Scikit-learn:
from sklearn.mixture import GaussianMixtureNext, let’s initialize an instance of the GaussianMixture class. Let’s start by considering three Python clusters and fit the model to our inputs (in this case, age and spending score):
from sklearn.mixture import GaussianMixture
n_clusters = 3
gmm_model = GaussianMixture(n_components=n_clusters)
gmm_model.fit(X)
Now, let’s generate the cluster labels and store the results, along with our inputs, in a new data frame:
cluster_labels = gmm_model.predict(X)
X = pd.DataFrame(X)
X['cluster'] = cluster_labels
Next, let’s plot each cluster within a for-loop:
for k in range(0,n_clusters):
    data = X[X["cluster"]==k]
    plt.scatter(data["Age"],data["Spending Score (1-100)"],c=color[k])
And, finally, format out plot:
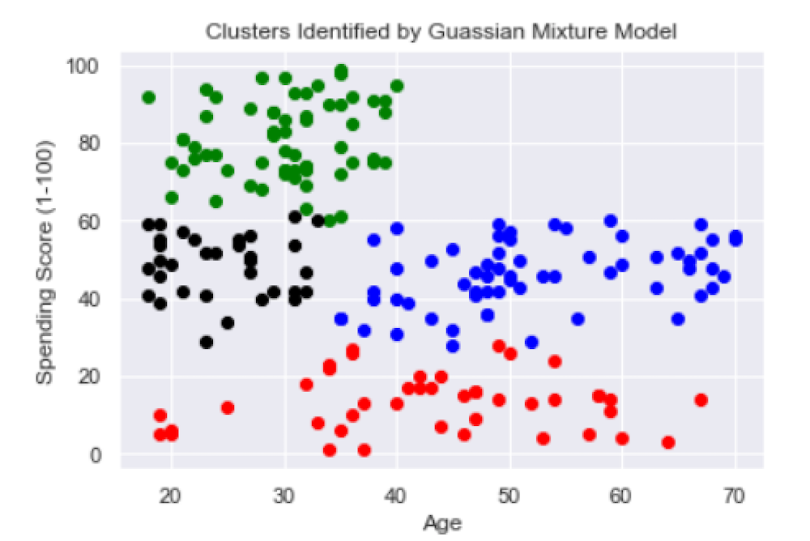
plt.title("Clusters Identified by Guassian Mixture Model")
plt.ylabel("Spending Score (1-100)")
plt.xlabel("Age")
plt.show()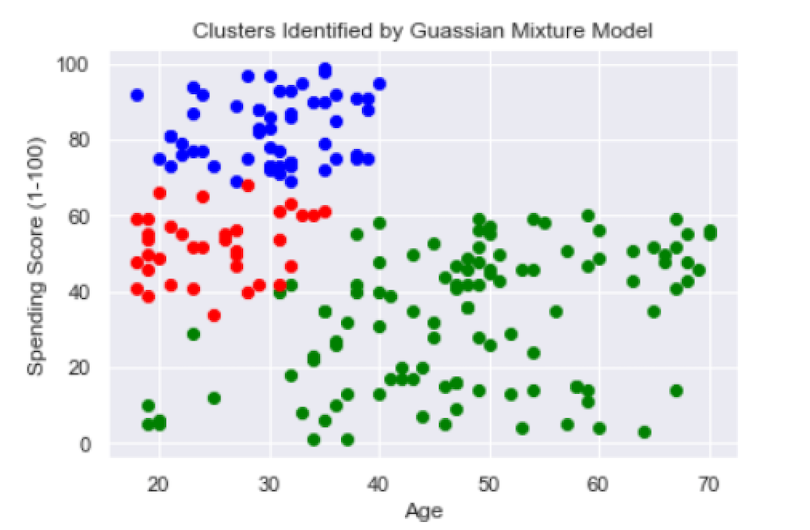
The red and blue clusters seem relatively well-defined. The blue cluster is young customers with a high spending score and the red is young customers with a moderate spending score. The green cluster is less well-defined since it spans all ages and both low to moderate spending scores.
Now, let’s try four clusters:
...
n_clusters = 4
gmm_model = GaussianMixture(n_components=n_clusters)
...
Although four clusters show a slight improvement, both the red and blue ones are still pretty broad in terms of age and spending score values. So, let’s try five clusters:

Five clusters seem to be appropriate here. They can be described as follows:
-
Young customers with a high spending score (green).
-
Young customers with a moderate spending score (black).
-
Young to middle-aged customers with a low spending score (blue).
-
Middle-aged to senior customers with a low spending score (yellow).
-
Middle-aged to senior customers with a moderate spending score (red).
Gaussian mixture models are generally more robust and flexible than K-means clustering in Python. Again, this is because GMM captures complex cluster shapes and K-means does not. This allows GMM to accurately identify Python clusters that are more complex than the spherical clusters that K-means identifies. GMM is an ideal method for data sets of moderate size and complexity because it is better able to capture clusters in sets that have complex shapes.
Spectral Clustering in Python
Spectral clustering is a common method used for cluster analysis in Python on high-dimensional and often complex data. It works by performing dimensionality reduction on the input and generating Python clusters in the reduced dimensional space. Since our data doesn’t contain many inputs, this will mainly be for illustration purposes, but it should be straightforward to apply this method to more complicated and larger data sets.
Let’s start by importing the SpectralClustering class from the cluster module in Scikit-learn:
from sklearn.cluster import SpectralClusteringNext, let’s define our SpectralClustering class instance with five clusters:
spectral_cluster_model= SpectralClustering(
    n_clusters=5,
    random_state=25,
    n_neighbors=8,
    affinity='nearest_neighbors'
)
Next, let’s define our model object to our inputs and store the results in the same data frame:
X['cluster'] = spectral_cluster_model.fit_predict(X[['Age', 'Spending Score (1-100)']])Finally, let’s plot our clusters:
fig, ax = plt.subplots()
sns.scatterplot(x='Age', y='Spending Score (1-100)', data=X, hue='cluster', ax=ax)
ax.set(title='Spectral Clustering')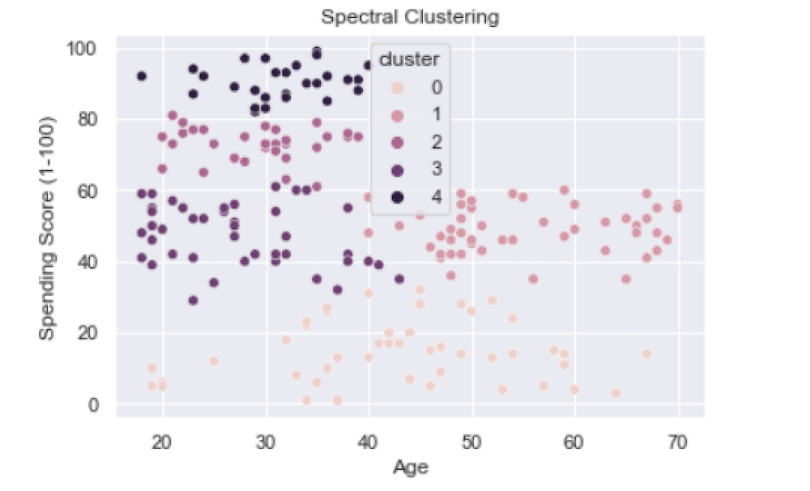
We see that clusters one, two, three and four are pretty distinct while cluster zero seems pretty broad. Generally, we see some of the same patterns with the cluster groups as we saw for K-means and GMM, though the prior methods gave better separation between clusters. Once again, spectral clustering in Python is better suited for problems that involve much larger data sets like those with hundred to thousands of inputs and millions of rows.
The code from this post is available on GitHub.
Add Clustering to Your Toolkit
Though we only considered cluster analysis in the context of customer segmentation, it is largely applicable across a diverse array of industries. The Python clustering methods we discussed have been used to solve a diverse array of problems. K-means clustering has been used for identifying vulnerable patient populations. Gaussian mixture models have been used for detecting illegal market activities such as spoof trading, pump and dump and quote stuffing. Spectral clustering methods have been used to address complex healthcare problems like medical term grouping for healthcare knowledge discovery.
Regardless of the industry, any modern organization or company can find great value in being able to identify important clusters from their data. Python provides many easy-to-implement tools for performing cluster analysis at all levels of data complexity. Further, having good knowledge of which methods work best given the data complexity is an invaluable skill for any data scientist. What we’ve covered provides a solid foundation for data scientists who are beginning to learn how to perform cluster analysis in Python.


