

The elbow method is a graphical representation technique used in k-means clustering to find the optimal ‘K’ value (the number of data clusters partitioned during clustering). This method is typically done by picking out the K value where the elbow (the point where a curve noticeably bends) is created. However, this is not always the best way to find the optimal ‘K’.
Elbow Method Definition
The elbow method is a graphical method for finding the optimal K value in a k-means clustering algorithm. The elbow graph shows the within-cluster-sum-of-square (WCSS) values on the y-axis corresponding to the different values of K (on the x-axis). The optimal K value is the point at which the graph forms an elbow.
In this blog, we will look at the most practical way of finding the number of clusters (or K) for your k-means clustering algorithm and why the elbow method isn’t the answer.
Following are the topics that we will cover in this blog:
- What is K-means clustering?
- What is the elbow method?
- What are the drawbacks of the elbow method?
- Why the Silhouette Method is better than the elbow method.
- How to do the elbow method in Python.
- How to do the Silhouette method in Python.
Let’s get started.
What Is K-Means Clustering?
K-means clustering is an unsupervised, distance-based clustering algorithm where data points that are close to each other are grouped in a given number of clusters/groups.
It’s one of the most used clustering algorithms in the field of data science. To successfully implement the k-means algorithm, we need to identify the number of clusters we want to create using the k-means.
The following are the steps followed by the k-means algorithm:
- Initialize K (i.e. the number of clusters to be created).
- Randomly assign K centroid points.
- Assign each data point to its nearest centroid to create K clusters.
- Re-calculate the centroids using the newly created clusters.
- Repeat steps 3 and 4 until the centroid gets fixed.
What Is the Elbow Method?
As mentioned, the elbow method involves determining the optimal K via a graphical representation. It works by choosing a range of K values (usually 1 through n, where n is a chosen number), and finding the within-cluster sum of squares (WCSS) value for each K value in the range.
WCSS is the sum of the square distance between data points in a cluster and the cluster centroid, essentially measuring how close points are clustered around their corresponding centroid.
The equation for WCSS is as follows:
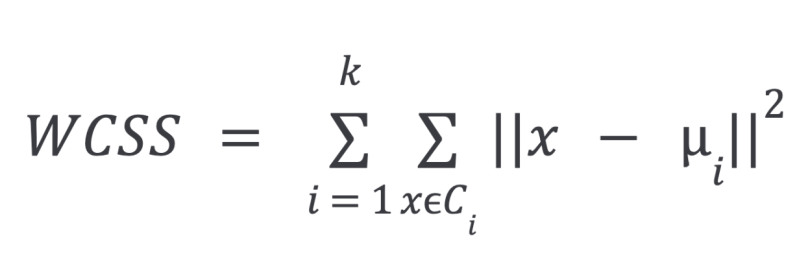
In the above equation:
k= number of clustersC= cluster- greek letter
mu= sample mean (cluster centroid) in cluster i
Both the K values used and their corresponding WCSS values are plotted against each other on a graph, and visualized by a curve.
The elbow graph shows WCSS values on the y-axis corresponding to the different values of K on the x-axis. When we see an elbow shape in the graph — where the curve noticeably bends or sharply decreases/increases — we pick the K value where the elbow gets created. We can call this the elbow point. Beyond the elbow point, increasing the value of ‘K’ does not lead to a significant reduction in WCSS.
What Are the Drawbacks of the Elbow Method?
The elbow curve is expected to look like this:

But here’s what it typically looks like:

So, in the majority of the real-world data sets, there’s not a clear elbow inflection point to identify the right ‘K’ using the elbow method. This makes it easier to find the wrong K.
Why the Silhouette Score Can Be Better Than the Elbow Method
The Silhouette score is a very useful method to find the number of K when the elbow method doesn’t show a clear elbow point.
The value of the Silhouette score ranges from -1 to 1. Following is the interpretation of the Silhouette score.
- 1: Points are perfectly assigned in a cluster and clusters are easily distinguishable.
- 0: Clusters are overlapping.
- -1: Points are wrongly assigned in a cluster.

Silhouette Score = (b-a) / max(a,b)
Where:
a= average intra-cluster distance (i.e. the average distance between each point within a cluster).b= average inter-cluster distance (i.e. the average distance between all clusters).
How to Use the Elbow Method in Python
Let’s compare the elbow method and the silhouette score using the Iris data set from scikit-learn. We’ll start with creating an elbow curve in Python.
The elbow curve can be created using the following code:
#install yellowbrick to vizualize the Elbow curve
!pip install yellowbrick

from sklearn import datasets
from sklearn.cluster import KMeans
from yellowbrick.cluster import KElbowVisualizer

# Load the IRIS dataset
iris = datasets.load_iris()
X = iris.data
y = iris.target

# Instantiate the clustering model and visualizer
km = KMeans(random_state=42)
visualizer = KElbowVisualizer(km, k=(2,10))

visualizer.fit(X)        # Fit the data to the visualizer
visualizer.show()        # Finalize and render the figure
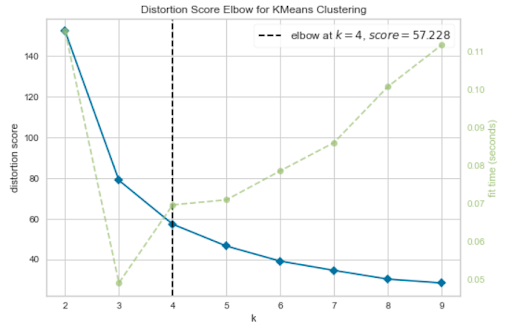
The above graph selects an elbow point at K=4, but K=3 also looks like a plausible elbow point. So, it’s not clear what the elbow point should be.
How to Use the Silhouette Score in Python
Let’s validate the value of K with the Silhouette plot using the below code.
from sklearn import datasets
from sklearn.cluster import KMeans
import matplotlib.pyplot as plt
from yellowbrick.cluster import SilhouetteVisualizer

# Load the IRIS dataset
iris = datasets.load_iris()
X = iris.data
y = iris.target

fig, ax = plt.subplots(3, 2, figsize=(15,8))
for i in [2, 3, 4, 5]:
    '''
    Create KMeans instances for different number of clusters
    '''
    km = KMeans(n_clusters=i, init='k-means++', n_init=10, max_iter=100, random_state=42)
    q, mod = divmod(i, 2)
    '''
    Create SilhouetteVisualizer instance with KMeans instance
    Fit the visualizer
    '''
    visualizer = SilhouetteVisualizer(km, colors='yellowbrick', ax=ax[q-1][mod])
visualizer.fit(X) 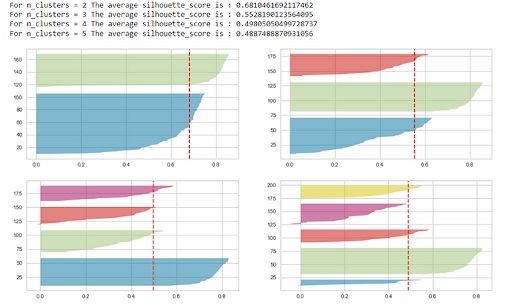
The silhouette score is maximum(0.68) for K=2, but that’s not sufficient to select the optimal K.
The following conditions should be checked to pick the right ‘K’ using the Silhouette plots:
- For a particular K, all the clusters should have a Silhouette score greater than the average score of the data set represented by the red-dotted line. The x-axis represents the Silhouette score. The clusters with
K=4and5get eliminated because they don’t follow this condition. - There shouldn’t be wide fluctuations in the size of the clusters. The width of the clusters represents the number of data points. For
K=2, the blue cluster has almost twice the width as compared to the green cluster. This blue cluster gets broken down into two sub-clusters forK=3, and thus forms clusters of uniform size.
So, the silhouette plot approach gives us K=3 as the optimal value.
We should select K=3 for the final clustering on the Iris data set.
import plotly.graph_objects as go  #for 3D plot

## K-means using k = 3
kmeans = KMeans(n_clusters=3)
kmeans.fit(X)
y_kmeans = kmeans.predict(X)

## 3D plot
Scene = dict(xaxis = dict(title  = 'sepal_length -->'),yaxis = dict(title  = 'sepal_width--->'),zaxis = dict(title  = 'petal_length-->'))

labels = kmeans.labels_
trace = go.Scatter3d(x=X[:, 0], y=X[:, 1], z=X[:, 2], mode='markers',marker=dict(color = labels, size= 10, line=dict(color= 'black',width = 10)))
layout = go.Layout(margin=dict(l=0,r=0),scene = Scene,height = 800,width = 800)
data = [trace]
fig = go.Figure(data = data, layout = layout)
fig.show()
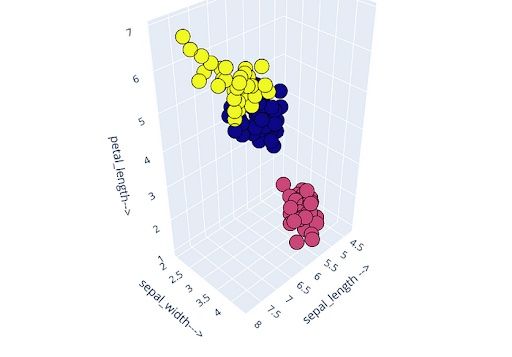
I also validated the output clusters by indexing/checking the distribution of the input features within the clusters.
Elbow Method vs. Silhouette Score Method
Elbow curve and Silhouette plots both are very useful techniques for finding the optimal K for k-means clustering. In real-world data sets, you will find quite a lot of cases where the elbow curve is not sufficient to find the right ‘K’. In such cases, you should use the silhouette plot to figure out the optimal number of clusters for your data set.
I would recommend using both the techniques together to figure out the optimal K for k-means clustering.
Frequently Asked Questions
What is the elbow method?
The elbow method is a technique used in k-means clustering to determine the optimal number of clusters (k) in a data set. An optimal K value identified from the elbow method tells us the ideal number of clusters where intra-cluster distance is minimized (data points inside each cluster are as close to each other as possible) and inter-cluster distance is maximized (distance between clusters is far enough that each cluster is distinct and well-separated from one another).
How does the elbow work?
The elbow method involves iterating over a range of K values (often 1 to n), calculating the within-cluster sum of squares (WCSS) for each value, plotting a graph with k on the x-axis and WCSS on the y-axis and finding the elbow of the graph curve. The “elbow” in the elbow method refers to the point on the curve that visibly bends (like an elbow).
Why not use the elbow method?
The elbow method may not be the most effective for finding an optimal K value in k-means clustering because it primarily considers intra-cluster distance and there may be no clear bend in its graph curve, making it more difficult to identify the best k. Other methods like silhouette score can be used to remedy this issue, as silhouette score, for example, considers both intra-cluster and inter-cluster distance.


