In machine learning, we often have high-dimensional data. If we’re recording 60 different metrics for each of our shoppers, we’re working in a space with 60 dimensions. If we’re analyzing grayscale images sized 50x50, we’re working in a space with 2,500 dimensions. If the images are RGB-colored, the dimensionality increases to 7,500 dimensions (one dimension for each color channel in each pixel in the image).
What Is The Curse of Dimensionality?
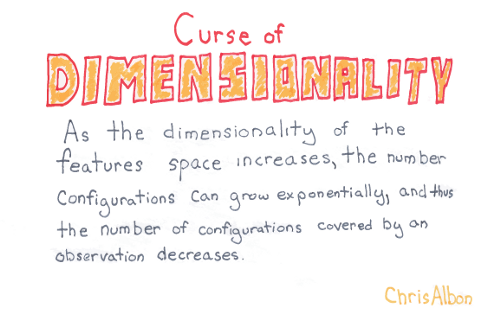
Regarding the curse of dimensionality — also known as the Hughes Phenomenon — there are two things to consider. On the one hand, ML excels at analyzing data with many dimensions. Humans are not good at finding patterns that may be spread out across so many dimensions, especially if those dimensions are interrelated in counter-intuitive ways. On the other hand, as we add more dimensions we also increase the processing power we need to analyze the data, and we also increase the amount of training data required to make meaningful data models.
High Dimensional Data

Hughes Phenomenon
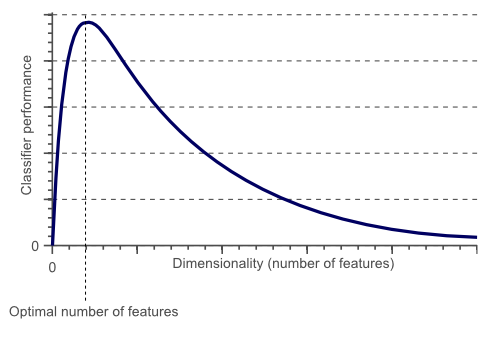
The Hughes Phenomenon shows that as the number of features increases, the classifier’s performance increases as well until we reach the optimal number of features. Adding more features based on the same size as the training set will then degrade the classifier’s performance.
Curse of Dimensionality in Distance Function
An increase in the number of dimensions of a dataset means there are more entries in the vector of features that represents each observation in the corresponding Euclidean space. We measure the distance in a vector space using Euclidean distance.
The Euclidean distance between 2-dimensional vectors with Cartesian coordinates p = (p1, p2, …, pn) and q = (q1, q2, …, qn) is computed using the familiar formula:

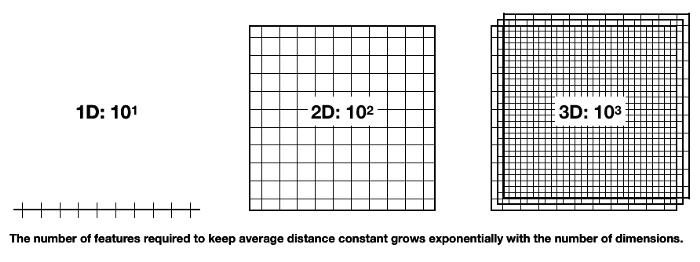
Hence, each new dimension adds a non-negative term to the sum, so the distance increases with the number of dimensions for distinct vectors. In other words, as the number of features grows for a given number of observations, the feature space becomes increasingly sparse; that is, less dense or emptier. On the flip side, the lower data density requires more observations to keep the average distance between data points the same.
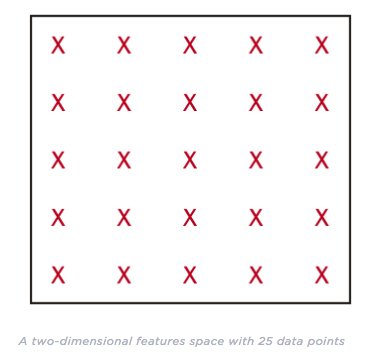
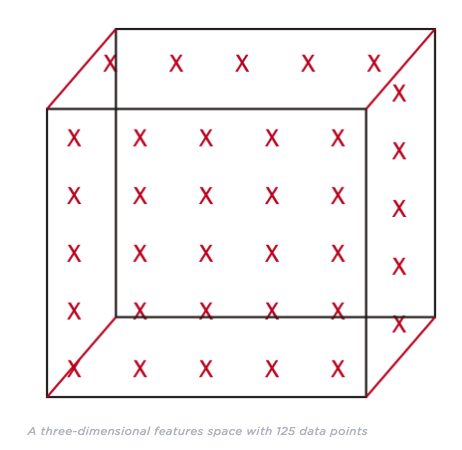
Similar to the above figures, below shows how many data points we need to maintain the average distance of 10 observations uniformly distributed on a line. It increases exponentially from 10¹ in a single dimension to 10² in two and 10³ in three dimensions, as the data needs to expand by a factor of 10 each time we add a new dimension:
The figure below simulates how the average and minimum distances between data points increase as the number of dimensions grows:

From the above figure, it is proven that with the increase in dimensions, mean distance increases rapidly. Hence the higher the dimensions, the more data is needed to overcome the curse of dimensionality!
When the distance between observations grows, supervised machine learning becomes more difficult because predictions for new samples are less likely to be based on learning from similar training features. The number of possible unique rows grows exponentially as the number of features increases, which makes it so much harder to efficiently generalize. The variance increases as they get more opportunity to overfit to noise in more dimensions, resulting in poor generalization performance.
In practice, features are correlated or do not exhibit much variation. For these reasons, dimensionality reduction helps compress the data without losing much of the signal, and combat the curse while also economizing on memory.
Overfitting and Underfitting
KNN is very susceptible to overfitting due to the curse of dimensionality. Curse of dimensionality also describes the phenomenon where the feature space becomes increasingly sparse for an increasing number of dimensions of a fixed-size training dataset. Intuitively, we can think of even the closest neighbors being too far away in a high-dimensional space to give a good estimate. Regularization is one way to avoid overfitting. However, in models where regularization is not applicable, such as decision trees and KNN, we can use feature selection and dimensionality reduction techniques to help us avoid the curse of dimensionality.
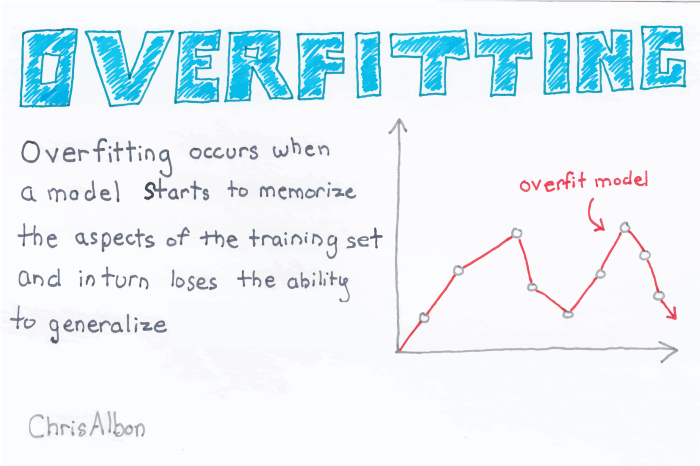
This notion is closely related to the problem of overfitting. As our training data is not enough, we risk producing a model that could be very good at predicting the target class on the training dataset but fail miserably when faced with new data. That is, our model does not have the generalization power. That is why it's so important to evaluate our methods on previously unseen data.
The general rule to avoid overfitting is to preference simple (i.e., less parameters) methods, something that could be seen as an instantiation of the philosophical principle of Occam’s Razor, which states that among competing hypotheses, the hypothesis with the fewest assumptions should be selected.
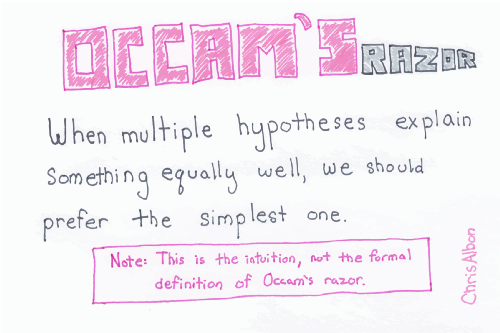
However, we should also take into account Einstein’s words: “Everything should be made as simple as possible, but not simpler.”
The idem curse of dimensionality may suggest that we keep our models simple, but on the other hand, if our model is too simple we run the risk of suffering from underfitting. Underfitting problems arise when our model has such a low representation power that it cannot model the data even if we had all the training data we want. We clearly have underfitting when our algorithm cannot achieve good performance measures even when measuring on the training set.
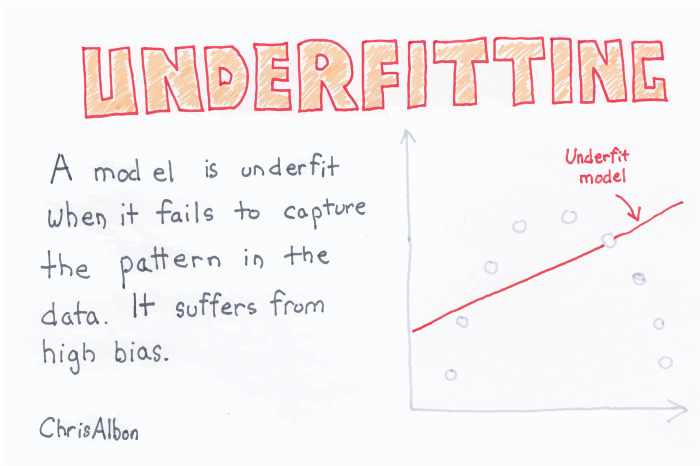
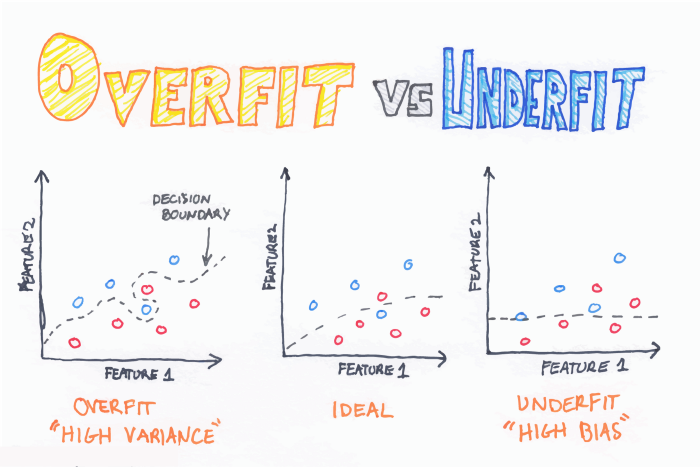
As a result, we will have to achieve a balance between overfitting and underfitting. This is one of the most important problems to address when designing our machine learning models.
Curse of Dimensionality Case:
https://nbviewer.jupyter.org/gist/BadreeshShetty/bf9cb1dced8263ef997bcb2c3926569b
OR
https://gist.github.com/BadreeshShetty/bf9cb1dced8263ef997bcb2c3926569b
From looking at the above case, it is proven that with increase in dimensions, mean distance increases logarithmically. Hence higher the dimensions, more data is needed to overcome the curse of dimensionality!
Read more content from Badreesh Shetty:
An In-Depth Guide to Supervised Machine Learning Classification
An In-Depth Guide to How Recommender Systems Work


