

I want to discuss some fundamental terms and concepts related to probability and statistics that come up in almost any machine learning and AI literature.
What Is Probability?
Probability Statistics and Theory Concepts to Know
13 Probability Statistics and Theory Terms to Know
- Random experiment
- Sample space
- Random variables
- Probability
- Conditional probability
- Independence
- Conditional independence
- Expectation
- Variance
- Probability distribution
- Joint probability distribution
- Conditional probability
- Factor
Random Experiment
A random experiment is a physical situation whose outcome cannot be predicted until it is observed.
Sample Space
A sample space is a set of all possible outcomes of a random experiment.

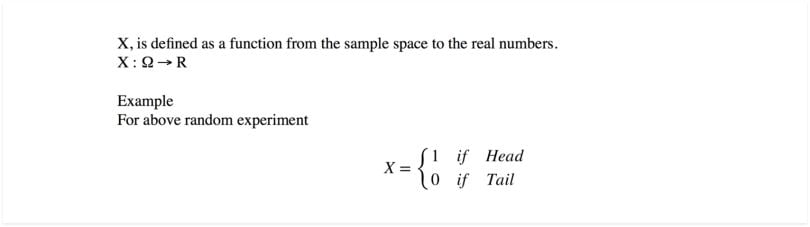
Random Variables
A random variable is a variable whose possible values are numerical outcomes of a random experiment. There are two types of random variables:
- Discrete random variable: This is a variable that may take on only a countable number of distinct values, such as zero, one, two, three, four, etc. Discrete random variables are usually, but not necessarily, counts.
- Continuous random variable: This is a variable that takes an infinite number of possible values. Continuous random variables are usually measurements.
Probability
Probability is the measure of the likelihood that an event will occur in a random experiment. Probability is quantified as a number between zero and one, where, loosely speaking, zero indicates impossibility and one indicates certainty. The higher the probability of an event, the more likely it is that the event will occur.
Example
A simple example is the tossing of a fair (unbiased) coin. Since the coin is fair, the two outcomes, “heads” and “tails,” are both equally probable. Since no other outcomes are possible, the probability of either “heads” or “tails” is 0.5 or 50%.
Conditional Probability
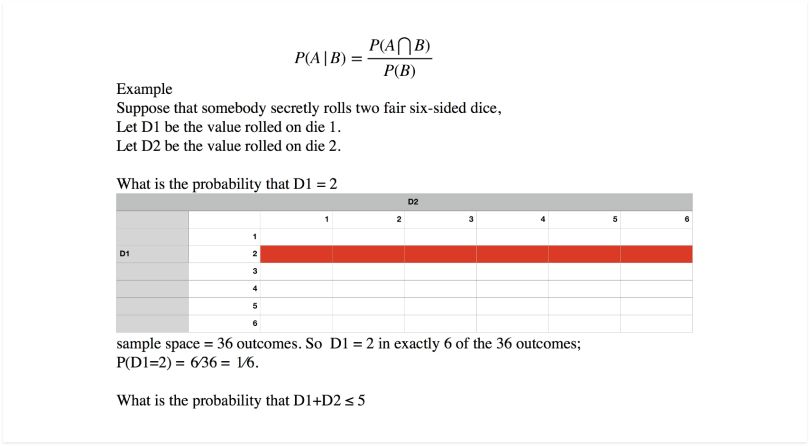
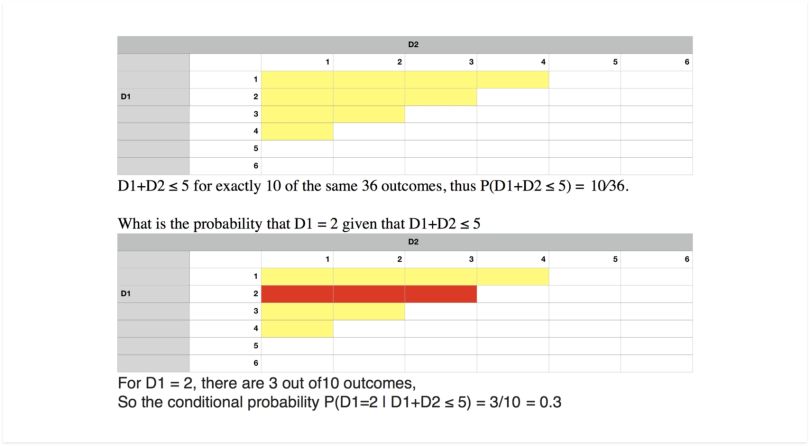
Conditional probability is a measure of the probability of an event occurring given that by assumption, presumption, assertion or evidence another event has already occurred. If the event of interest is A, and event B is known or assumed to have occurred, “the conditional probability of A given B” is usually written as P(A|B).
Independence
Two events are said to be independent of each other if the probability that one event occurs in no way affects the probability of the other event occurring. In other words, if we have observations about one event, it doesn’t affect the probability of the other. For independent events A and B, below is true:

Example
For example, let’s say you rolled a die and flipped a coin. The probability of getting any number face on the die in no way influences the probability of getting a head or a tail on the coin.
Conditional Independence
Events A and B are conditionally independent given a third event C precisely if the occurrence of A and the occurrence of B are independent events in their conditional probability distribution given C. In other words, A and B are conditionally independent given C, if and only if, given knowledge that C already occurred, knowledge of whether A occurs provides no additional information on the likelihood of B occurring. And knowledge of whether B occurs provides no additional information on the likelihood of A occurring.

Example
A box contains two coins, a regular coin and a fake, two-headed coin (P(H)=1P(H)=1). I choose a coin at random and toss it twice.
Let:
- A = First coin toss results in an HH.
- B = Second coin toss results in an HH.
- C = Coin 1 (regular) has been selected.
If C is already observed, i.e. we already know whether a regular coin is selected or not, the event A and B becomes independent as the outcome of one doesn’t affect the outcome of the other event.
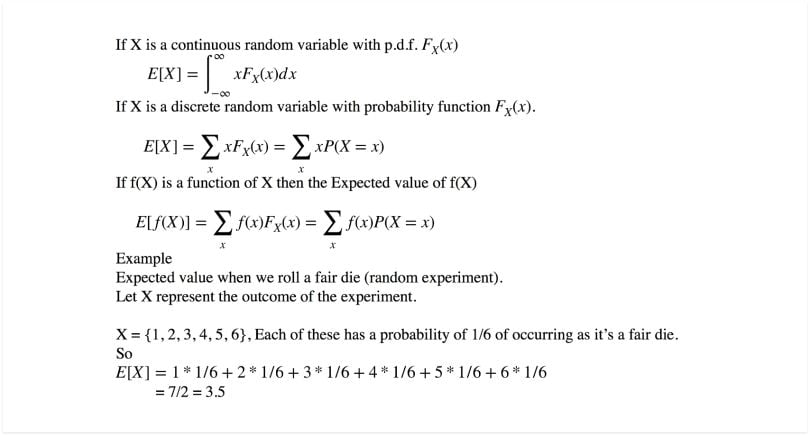
Expectation
The expectation of a random variable X is written as E(X). If we observe N random values of X, then the mean of the N values will be approximately equal to E(X) for large N. In more concrete terms, expectation is what you would expect the outcome of an experiment to be on an average if you repeat the experiment a large number of times.
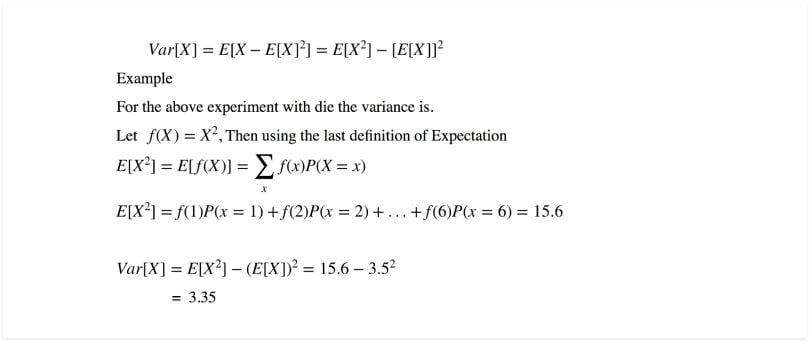
Variance
The variance of a random variable X is a measure of how concentrated the distribution of a random variable X is around its mean. It’s defined as:
Probability Distribution
Probability distribution is a mathematical function that maps all possible outcomes of a random experiment with its associated probability. It depends on the random variable X and whether it’s discrete or continues.
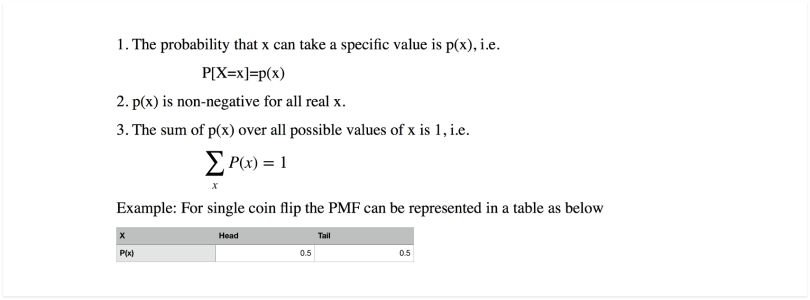
1. Discrete probability distribution
The mathematical definition of a discrete probability function, p(x), is a function that satisfies the following properties. This is referred to as probability mass function.
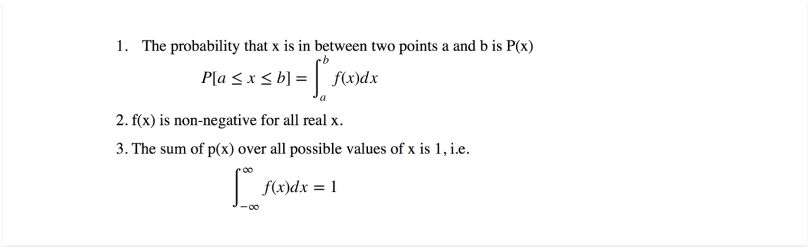
2. Continuous Probability Distribution
The mathematical definition of a continuous probability function, f(x), is a function that satisfies the following properties. This is referred to as a probability density function.
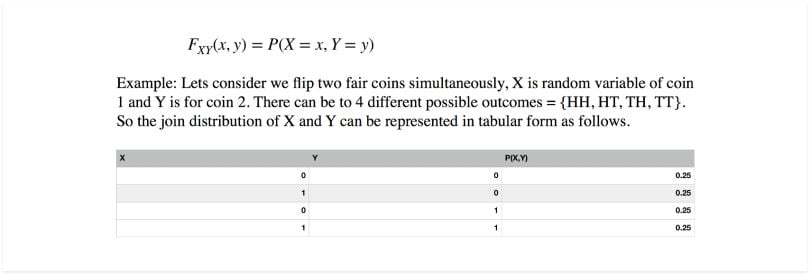
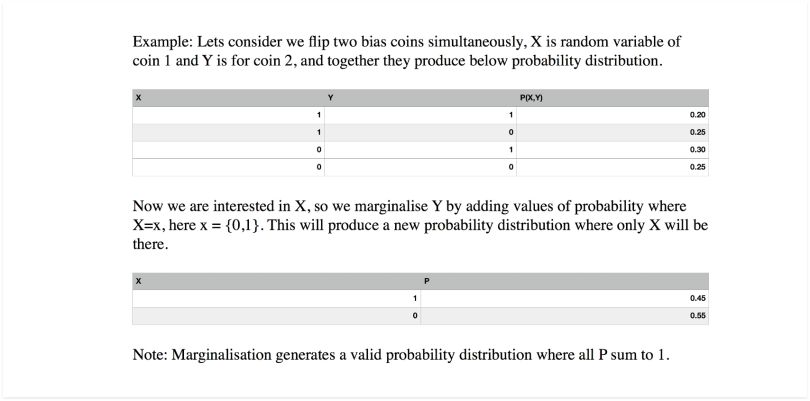
Joint Probability Distribution
If X and Y are two random variables, the probability distribution that defines their simultaneous behavior during outcomes of a random experiment is called a joint probability distribution. The joint distribution function of X and Y, is defined as:
Conditional Probability Distribution (CPD)
If Z is random variable who is dependent on other variables X and Y, then the distribution of P(Z|X,Y) is called a conditional probability distribution (CPD) of Z with regards to X and Y. This means that for every possible combination of random variables X, Y, we represent a probability distribution over Z.
Example
There is a student who has a property called “intelligence” which can be either low(I_0) or high(I_1). They enroll into a course, and that course has a property called “Difficulty,” which can take binary values easy(D_0) or difficult(D_1). The student gets a “Grade” in the course based on his performance. Grade can take three values G_1(best), (G_2) or (G_3)(worst). Then the CPD P(G|I,D) is as follows:

There are a number of operations that one can perform over any probability distribution to get interesting results. Some of the important operations include:
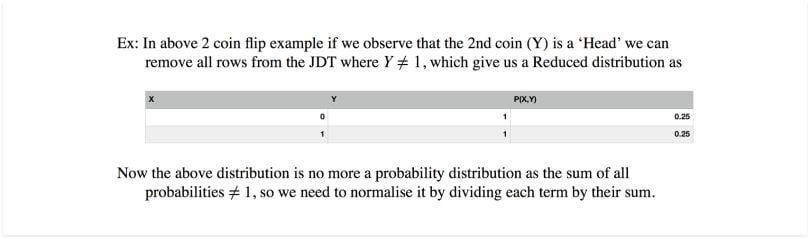
1.Conditioning/Reduction
If we have a probability distribution of n random variables X1, X2 … Xn, and we make an observation about k variables that they acquired certain values a1, a2, …, ak, this means we already know their assignments. Then the rows in the JD which are not consistent with the observation can be removed leaving us with fewer rows. This operation is known as reduction.
2. Marginalization
This operation takes a probability distribution over a large set of random variables and produces a probability distribution over a smaller subset of the variables. This operation is known as marginalizing a subset of random variables. It’s very useful when we have a large set of random variables as features, and we’re interested in a smaller set of variables and how it affects output.
Factor
A factor is a function or a table that takes a number of random variables {X_1, X_2,…,X_n} as an argument and produces a real number as an output. The set of input random variables are called scope of the factor. For example, joint probability distribution is a factor that takes all possible combinations of random variables as input and produces a probability value for that set of variables that is a real number. Factors are the fundamental block to represent distributions in high dimensions, and it supports all basic operations that joint distributions can be operated on like product, reduction and marginalization.

Factor Product
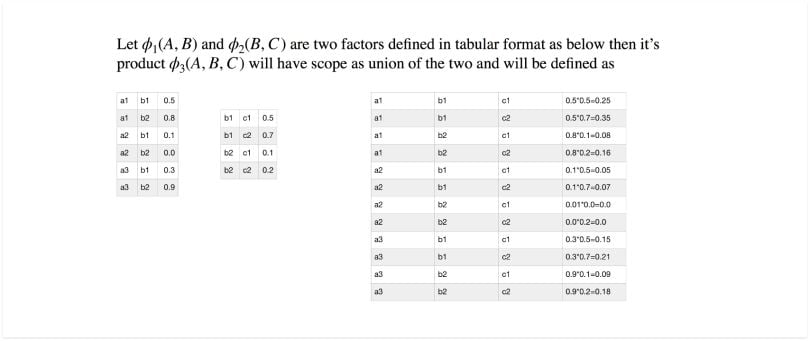
We can do factor products and the result will also be a factor.
Frequently Asked Questions
What is a random experiment in probability?
A random experiment is a process or situation with uncertain outcomes that can only be known once observed.
What are random variables and how are they classified?
Random variables represent numerical outcomes of random experiments and are classified as either discrete (countable values) or continuous (measurable values).
How is probability defined in statistics?
Probability measures the likelihood of an event occurring, expressed as a number between 0 and 1.
What is conditional probability?
Conditional probability measures the chance of an event occurring given that another event has already occurred, denoted as P(A'B).


