K-means is a very simple clustering algorithm used in machine learning. Clustering is an unsupervised learning task. Learning is unsupervised when it requires no labels on its data. Such algorithms can find inherent structure and patterns in unlabeled data. Contrast this with supervised learning, where a model learns to match inputs to corresponding outputs, which requires the data to be labeled.
Clustering is perhaps the simplest unsupervised learning task to understand. In a data set, it’s possible to see that certain data points cluster together and form a natural group.
For example, suppose we have a lot of data on the behavior of YouTube viewers. We might identify one set of users who visit the site frequently, stay on for a long time, and typically reach videos through the subscription feed. Call these “power users.” We might also see a group of “casual users” who visit the site only occasionally, don’t stick around for very long, and typically reach videos from the home page, recommendation bar or directly from links.
Clustering techniques can identify such groups of users automatically, without any human having to label some users as power users and others as casual. Such an algorithm won’t be able to tell us what these clusters mean, but if there are groups of users with different behavior, it can at least detect that they exist and identify their key qualities. We can then decide what to do from there.
Now let’s get into it!
K-Means Algorithm
K-means is a simple clustering algorithm in machine learning. In a data set, it’s possible to see that certain data points cluster together and form a natural group. The goal of k-means is to locate the centroids around which data is clustered They are the “means” in “k-means.” If we know where these points are, the intuition behind the algorithm is that we can then classify each point by assigning it to its closest cluster center.
How Does the K-Means Algorithm Work?
Consider the following unlabeled data:
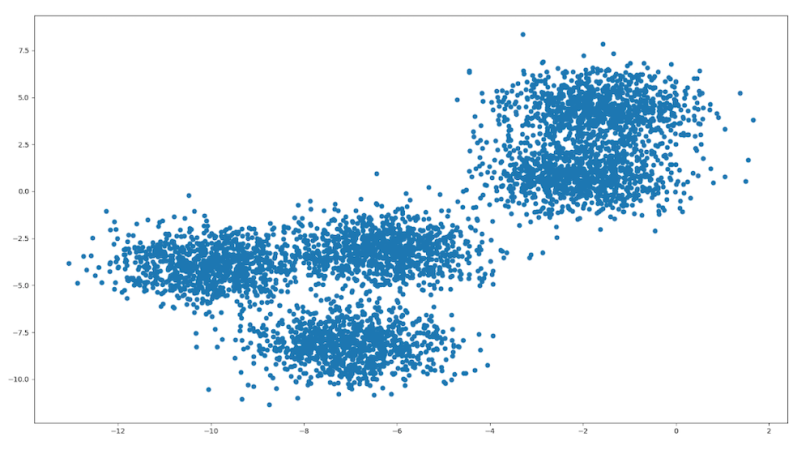
It was randomly generated to cluster around five central points, called centroids. The goal of k-means is to locate these centroids; they are the “means” in “k-means.” If we know where these points are, the intuition behind the algorithm is that we can then classify each point by assigning it to its closest cluster center.
Okay, but how do we find these centroids? First, we must tell the algorithm how many there are. In this case, there are five. The algorithm then makes a guess, choosing five random points as its initial centroids. Next, it looks at all the points assigned to the same cluster. It’s likely that the centroid we initially picked is actually not at the center of this cluster (as you can see in the visualization below). So, we update our guess by moving the centroid to the middle of the cluster and do the same for every other centroid. We then repeat this process until the centers stop moving.
As an example, here’s what the first three steps of (one particular run of) k-means looks like on this data set:
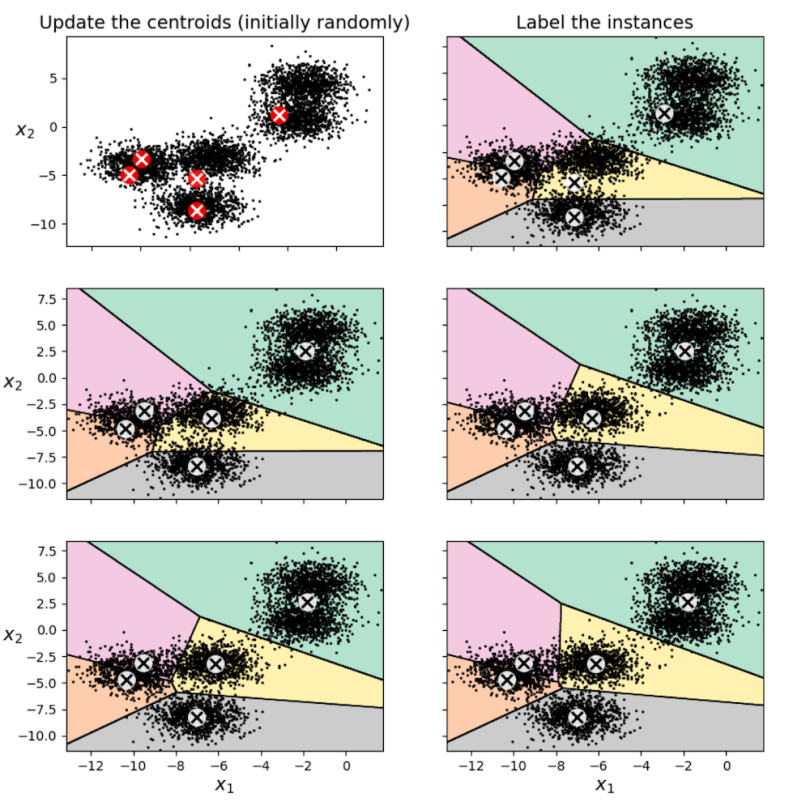
In the top left, we have our initial choice of five random centroids. In the top right, we assign each point to its closest centroid and color the regions accordingly. In the middle left, we then shift our centroids to the middle of our identified clusters, and so on. Running the full algorithm, we eventually get the following clustering:
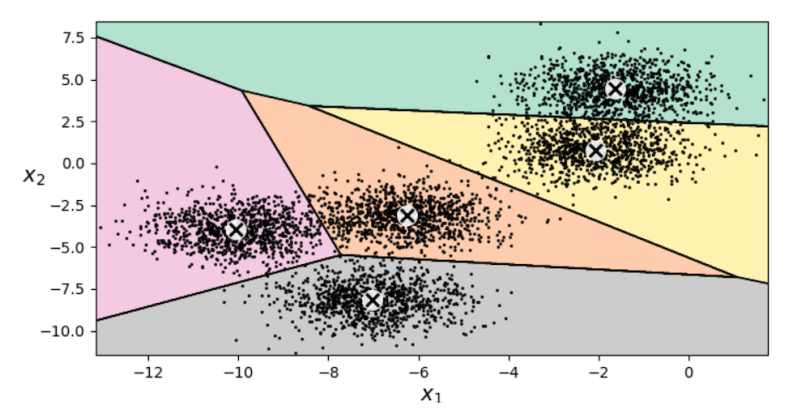
Looks pretty good! These five centroids now lie right at the centers of the five clusters in our data.
If you’re looking to use this algorithm, the machine learning library Scikit-learn has an easy-to-use, built-in k-means class. It comes with some extra optimizations by default. For example, it biases the initial choice of centroids to be more spread out than would typically occur from a purely random choice. It also repeats the algorithm a number of times from scratch and returns the best clustering it finds.
Without this, it’s easy for k-means to get stuck on a clustering that’s too densely packed in one area. For example, look back at the second figure above. We can see that k-means initially has a lot more centroids in the bottom-left than the top-right. If we get an unlucky run, the algorithm may never realize that the “cluster” in the top-right is actually two clusters.
Advantages of K-Means
The main advantages of k-means are its simplicity, speed and scalability. Understanding and implementing k-means is simple, and it’s always good to understand your tools. In practice, it also runs quite fast and even works well for large data sets. It’s also guaranteed to terminate (although not necessarily to the optimal answer), so the algorithm won’t keep moving its centers back and forth forever.
Disadvantages of K-Means (and How to Fix Them)
K-means has some disadvantages, however. First, we must choose the number of clusters k in advance; the algorithm does not determine it for us. If you have some prior knowledge about how many there should be, all well and good. Otherwise, you’ll have to tune the choice of k. This can be tricky, but there are a few potential solutions.
What Is Inertia in K-Means Clustering?
The inertia of a k-means model is the average mean-squared distance of each point to its assigned centroid.
It’s not enough to just minimize inertia since making k larger always lowers it. If we set k to 10 in our last example, then points would be much closer to their centers, but it wouldn’t be a very natural clustering Often, however, if you try increasing values of k, you will see an initial sharp dropoff in inertia with diminishing returns as k gets larger. Values of k just before these diminishing returns are good candidates.
Another potential solution is to use the silhouette score, a metric which rewards the model for having points near their centroids but also penalizes it for points being too close to other centroids. This can disincentivize having too many clusters. Looking for ks that score high on this metric is another good way to find candidate values. Additionally, if your k-means model is part of a larger, supervised learning system, as I discuss more later, then you can tune k in a straightforward way in order to minimize loss of the overall system.
K-means is also sensitive to the positions of the initial centroids. It can get stuck at a local optimum and end up with a crummy answer. But we’ve already discussed how to address this: initialize centroids to be spread out, and run the algorithm multiple times. Since k-means is fairly fast, this isn’t too much of a problem.
Next, k-means is sensitive to the scale of the data. Distance in each direction is treated as equally important, so if one of your features is on a larger scale (e.g., a weight of 100 to 500 pounds versus length of five to 10 feet), k-means will treat it as more important. You can address this problem relatively easily by rescaling your data.
Harder to overcome is that k-means is sensitive to the shape of the data. The algorithm only learns spherical clusters, so if your data has clusters of a different shape, it will struggle to learn them. K-means is also sensitive to outliers and struggles with higher-dimensionality data. For example, k-means would have a hard time clustering 1024 by 1024 images since our data points would have over a million dimensions.
Applications of K-Means Algorithm in Machine Learning
K-means has lots of applications. One is customer segmentation, which we discussed in the YouTube example at the start. This means identifying groups of similar users and can be useful to better understand your userbase. What sorts of people are using your product, and what for and in what way? This may inform overall design decisions and business strategies.
Customer segmentation is also useful from the more computational side. Continuing with the YouTube example, we can recommend videos or channels to users based on what other people in their cluster are watching.
Another use case is anomaly detection. If some new data point is very far from all your existing clusters, then something strange is going on and may warrant investigation. Suppose we find some YouTube account which clicks on a video, immediately likes it, then moves on and repeats. This is probably a bot that you want to deactivate. Fortunately, its behavior likely does not fit into your natural clusters of users, and we can detect this automatically.
Yet another use is dimensionality reduction and feature engineering. Our data may have dozens of dimensions but only, say, five significant clusters. If we transform each point by representing it with its distance to each centroid, we can drastically reduce the dimensionality of our data. This can speed up learning if we then feed our transformed data into a supervised learning algorithm. Alternatively, we could add these distances as new features to our data set to aid learning, rather than throwing out the original features entirely.
Finally, consider semi-supervised learning, when only a small fraction of our data is labeled. Suppose we have a set of handwritten digits, like the classic MNIST problem. If we have 100,000 such pictures, but only 10 percent of them are labeled, supervised learning might not do very well on just that 10 percent. Is there some way we can use the other 90 percent of the data to our advantage?
Yes! If we cluster the data, we can identify groups of pictures that are probably the same digit without any labeling required. If we then find the labeled picture closest to each centroid, we can propagate its label to the other pictures in the cluster or possibly just the pictures closest to the centroid. We then have a much larger amount of labeled data to train on.
K-means can be a particularly good strategy for semi-supervised classification since we know something about the number of clusters in advance: It’s tied to the number of classes. Usually, we’ll want to set k to be some small multiple of the number of classes. Here, we might have 50 clusters since there are multiple ways to write each digit.
And that’s k-means! Remember to go check out the Scikit-learn k-means class to start using the algorithm right away.