

Clustering is an unsupervised machine learning technique that groups data points based on the similarities (shape, color, behavior, etc.) between them.
In this article, we will discuss connectivity-based clustering algorithms, also called hierarchical clustering.
Hierarchical Clustering Definition
Hierarchical clustering is a clustering analysis technique that places data points into hierarchical groups, or hierarchical clusters, based on similarities.
What Is Hierarchical Clustering?
Hierarchical clustering, or hierarchical clustering analysis, is a cluster analysis technique that creates a hierarchy of clusters from points in a dataset.
With clustering, data points are put into groups — known as clusters — based on similarities like color, shape or other features. In hierarchical clustering, each cluster is placed within a nested tree-like hierarchy, where clusters are grouped and break down further into smaller clusters depending on similarities. Here, the closer clusters are together in the hierarchy, the more similar they are to each other.
While clustering analyses like k-means can visualize data points as distinct and linear groups, hierarchical clustering visualizes data groups in relation to one another with multiple levels of similarity.
Hierarchical clustering is used to help find patterns and related occurrences within datasets, especially those that are complex or multifaceted.
How Does Hierarchical Clustering Work?
The hierarchical clustering process involves finding the two data points closest to each other and combining the two most similar ones. After repeating this process until all data points are grouped into clusters, the end result is a hierarchical tree of related groups known as a dendrogram.
Hierarchical clustering is based on the core idea that similar objects lie nearby to each other in a data space while others lie far away. It uses distance functions to find nearby data points and group the data points together as clusters.
There are different types of clustering algorithms, including centroid-based clustering algorithms, connectivity-based clustering algorithms (hierarchical clustering), distribution-based clustering algorithms and density-based clustering algorithms. The two main types of hierarchical clustering include agglomerative clustering and divisive clustering.
Types of Hierarchical Clustering
There are two major types of hierarchical clustering approaches:
- Agglomerative clustering: Divide the data points into different clusters and then aggregate them as the distance decreases.
- Divisive clustering: Combine all the data points as a single cluster and divide them as the distance between them increases.
1. Agglomerative Clustering
Agglomerative clustering is a bottom-up approach. It starts clustering by treating the individual data points as a single cluster, then it is merged continuously based on similarity until it forms one big cluster containing all objects. It is good at identifying small clusters.
The steps for agglomerative clustering are:
- Compute the proximity matrix using a distance metric.
- Use a linkage function to group objects into a hierarchical cluster tree based on the computed distance matrix from the above step.
- Data points with close proximity are merged together to form a cluster.
- Repeat steps 2 and 3 until a single cluster remains.
The pictorial representation of the above steps would be:
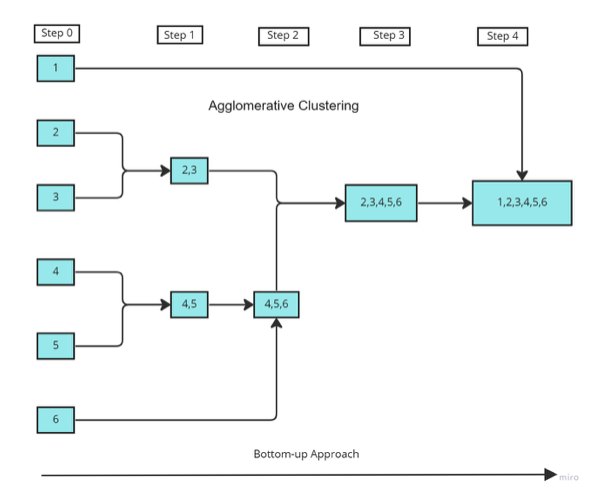
In the above figure,
- The data points 1,2,...6 are assigned to each individual cluster.
- After calculating the proximity matrix, based on the similarity the points 2,3 and 4,5 are merged together to form clusters.
- Again, the proximity matrix is computed and clusters with points 4,5 and 6 are merged together.
- And again, the proximity matrix is computed, then the clusters with points 4,5,6 and 2,3 are merged together to form a cluster.
- As a final step, the remaining clusters are merged together to form a single cluster.
Proximity Matrix and Linkage
The proximity matrix is a matrix consisting of the distance between each pair of data points. The distance is computed by a distance function. Euclidean distance is one of the most commonly used distance functions.
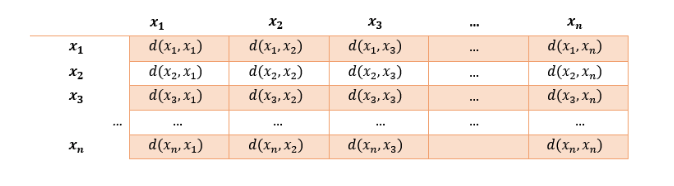
The above proximity matrix consists of n points named x, and the d(xi,xj) represents the distance between the points.
In order to group the data points in a cluster, a linkage function is used where the values in the proximity matrix are taken and the data points are grouped based on similarity. The newly formed clusters are linked to each other until they form a single cluster containing all the data points.
The most common linkage methods are:
- Complete linkage: The maximum of all pairwise distance between elements in each pair of clusters is used to measure the distance between two clusters.
- Single linkage: The minimum of all pairwise distance between elements in each pair of clusters is used to measure the distance between two clusters.
- Average linkage: The average of all pairwise distances between elements in each pair of clusters is used to measure the distance between two clusters.
- Centroid linkage: Before merging, the distance between the two clusters’ centroids are considered.
- Ward’s Method: It uses squared error to compute the similarity of the two clusters for merging.
Agglomerative Clustering Implementation
Agglomerative clustering can be implemented in Python using sklearn and SciPy. Let’s implement Agglomerative clustering on the Iris dataset. The dataset can be found here. As a first step, import the necessary libraries and read the dataset.
import pandas as pd
import numpy as np

data_path = "/content/Iris.csv"
#read the data
df = pd.read_csv(data_path)
#select only feature columns
X = df[['SepalLengthCm', 'SepalWidthCm', 'PetalLengthCm', 'PetalWidthCm']]
Now we can use agglomerative clustering class from sklearn to cluster the data points.
#import the class
from sklearn.cluster import AgglomerativeClustering
#instantiate the model
model = AgglomerativeClustering(n_clusters = 3, affinity = 'euclidean', linkage = 'ward')
#fit the model and predict the clusters
y_pred = model.fit_predict(X)
In the above code, at first we import the agglomerative clustering class and instantiate the model with the required parameters. We use the clusters of three since there are three classes in the Iris dataset and we use the ward linkage function with the euclidean function as a distance metric which is specified in affinity parameter.
Since we know the number of species in the Iris dataset, we were able to specify the number of clusters in the parameter but in most cases of unsupervised learning, we don’t know the number of clusters beforehand. So how can we find the optimal number of clusters for hierarchical clustering?
Dendrogram Charts
The way to find the optimal number of clusters in hierarchical clustering is to use a dendrogram chart. Let’s see how we can identify an optimal number of clusters for the Iris dataset. For this, we can use the SciPy library in Python.
#import the necessary libraries
from scipy.cluster.hierarchy import dendrogram, linkage
import matplotlib.pyplot as plt

plt.figure(figsize=(15,6))
plt.title('Dendrogram')
plt.xlabel('Flowers')
plt.ylabel('Euclidean distances')
#create linkage matrix
link_matrix = linkage(X,method='ward')
dendrogram = dendrogram(link_matrix)
plt.savefig("iris.png")
plt.show()
In the above code, the dendrogram chart is created as follows:
- Import the necessary libraries.
- Create a linkage matrix with the linkage function from SciPy. Here we use the ward method.
- Pass the linkage matrix to the dendrogram function to plot the chart.
The chart is shown here:
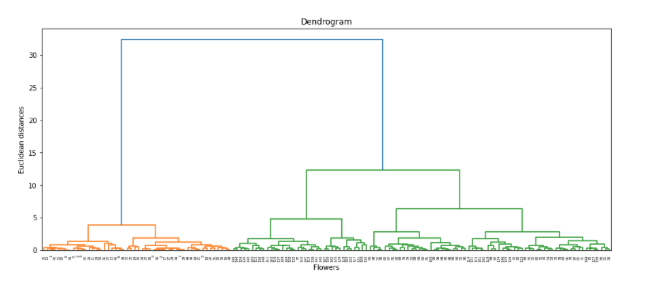
From the above chart we can visualize the hierarchical technique, so how to find the optimal number of clusters from the above chart?
To find it, draw a horizontal line where there is no overlap in the vertical lines of the bars. The number of bars without the overlap below the line is the optical number of the clusters. Refer to the figure below for a clear illustration.

From the above figure, we have three bars below the horizontal line, so the optimal number of clusters is three. Also, if you recall, the Iris dataset has three classes and we got the same number from the above chart.
2. Divisive Clustering
Divisive clustering works just the opposite of agglomerative clustering. It starts by considering all the data points into a big single cluster and later on splitting them into smaller heterogeneous clusters continuously until all data points are in their own cluster. Thus, they are good at identifying large clusters. It follows a top-down approach and is more efficient than agglomerative clustering. But, due to its complexity in implementation, it doesn’t have any predefined implementation in any of the major machine learning frameworks.
Steps in Divisive Clustering
Consider all the data points as a single cluster.
- Split into clusters using any flat-clustering method, say k-means.
- Choose the best cluster among the clusters to split further, choose the one that has the largest Sum of Squared Error (SSE).
- Repeat steps 2 and 3 until a single cluster is formed.

In the above figure,
- The data points 1,2,...6 are assigned to large cluster.
- After calculating the proximity matrix, based on the dissimilarity the points are split up into separate clusters.
- The proximity matrix is again computed until each point is assigned to an individual cluster.
The proximity matrix and linkage function follow the same procedure as agglomerative clustering, As the divisive clustering is not used in many places, there is no predefined class/function in any Python library.
Uses of Hierarchical Clustering
Hierarchical clustering can be used for several applications, ranging from customer segmentation to object recognition.
Market Segmentation
Companies can better understand their markets by identifying target groups based on certain traits like demographics, personal interests or behaviors. Organizing consumers according to these characteristics enables organizations to see what consumers care about and whose backgrounds or interests may align with their products and services. Businesses can then tailor products, marketing ads and other materials according to the preferences of target audiences.
Geo-Spatial Analysis
Besides grouping individual consumers or customers based on specific traits, hierarchical clustering can also group individuals based on their geographic location. Organizations can then view where their customer bases are located, predict product demand in certain areas and adjust their marketing and business strategies accordingly.
Image Segmentation
When dealing with images, hierarchical clustering can distinguish between separate visual elements. For example, the technique can discern between different facial features, aiding facial recognition technology. It can also discriminate between cars and other objects like buildings and animals, powering image recognition technology.
Anomaly Detection
Hierarchical clustering is also effective at detecting anomalies. By clustering data points into groups, hierarchical clustering can isolate outliers that don’t belong to any cluster. Researchers can apply this method to root out errors at different stages of the data collection process, preventing anomalies from impacting the accuracy of data sets.
Limits of Hierarchical Clustering
Hierarchical clustering isn’t a fix-all; it does have some limits. Among them:
- It has high time and space computational complexity. For computing proximity matrix, the time complexity is O(N2), since it takes N steps to search, the total time complexity is O(N3).
- There is no objective function for hierarchical clustering.
- Due to high time complexity, it cannot be used for large datasets.
- It is sensitive to noise and outliers since we use distance metrics.
- It has difficulty handling large clusters.
Clustering helps with the analysis of an unlabelled dataset to group the data points based on their similarity. In terms of business needs, clustering helps quickly segment customers and get insightful decisions.
In this article, we discussed hierarchical clustering, which is a type of unsupervised machine learning algorithm that works by grouping clusters based on distance measures and similarity. We also learned about the types of hierarchical clustering, how it works and implementing the same using Python.
Frequently Asked Questions
What is an example of a hierarchical cluster?
Consider a collection of four birds. Hierarchical clustering analysis may group these birds based on their type, pairing the two robins together and the two blue jays together.
What are the two methods of hierarchical cluster?
Agglomerative clustering and divisive clustering are the two methods of hierarchical clustering.
What is hierarchical clustering used for?
Hierarchical clustering is used for grouping customers based on shared traits to inform marketing campaigns, sorting images to help with facial recognition, detecting outliers to correct data analysis errors and determining customers’ locations to gauge local product demand.


