Feature engineering is the process of selecting, manipulating and transforming raw data into features that can be used in supervised learning. It’s also necessary to design and train new machine learning features so it can tackle new tasks. A “feature” is any measurable input that can be used in a predictive model. It could be the color of an object or the sound of someone’s voice. Feature engineering is the act of converting raw observations into desired features using statistical or machine learning approaches.
Feature Engineering Definition
Feature engineering is the process of selecting, manipulating and transforming raw data into features that can be used in supervised learning. It consists of five processes: feature creation, transformations, feature extraction, exploratory data analysis and benchmarking.
In this article we’ll cover:
- What is feature engineering?
- Importance of feature engineering.
- Feature engineering techniques for machine learning.
- Best tools for feature engineering.
What Is Feature Engineering?
Feature engineering is a machine learning technique that leverages data to create new variables that aren’t in the training set. It can produce new features for both supervised and unsupervised learning, with the goal of simplifying and speeding up data transformations while also enhancing model accuracy. Feature engineering is required when working with machine learning models. Regardless of the data or architecture, a terrible feature will have a direct impact on your model.
To better understand it, let’s look at a simple example. Below are the prices of properties in x city. It shows the area of the house and total price.
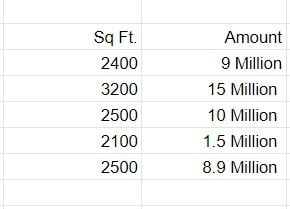
This data might have some errors or might be incorrect but not all sources on the internet are correct. To begin, we’ll add a new column to display the cost per square foot.
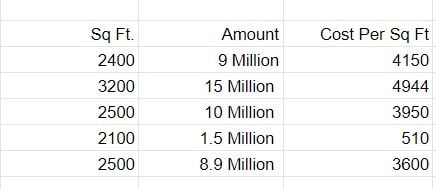
This new feature will help us understand a lot about our data. So, we have a new column which shows cost per square foot. There are three main ways you can find any error. You can use Domain Knowledge to contact a property advisor or real estate agent and show him the per square foot rate. If your counsel states that pricing per square foot can’t be less than $3,400, you may have a problem. The data can be visualized this way:
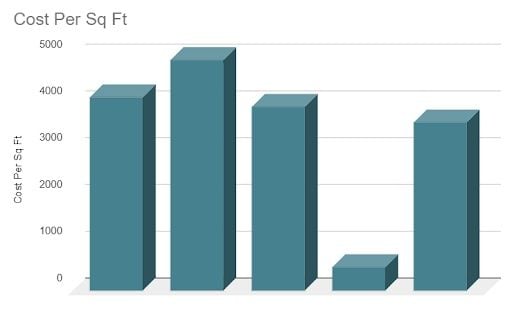
When you plot the data, you’ll notice that one price is significantly different from the rest. In the visualization method, you can readily notice the problem. The third way is to use statistics to analyze your data and find any problem.
Feature Engineering Processes
Feature engineering consists of various processes:
- Feature creation: Creating features involves creating new variables which will be most helpful for our model. This can be adding or removing some features. As we saw above, the cost per sq. ft column was a feature creation.
- Transformations: Feature transformation is simply a function that transforms features from one representation to another. The goal here is to plot and visualize data. If something isn’t adding up with the new features, we can reduce the number of features used, speed up training or increase the accuracy of a certain model.
- Feature extraction: Feature extraction is the process of extracting features from a data set to identify useful information. Without distorting the original relationships or significant information, this compresses the amount of data into manageable quantities for algorithms to process.
- Exploratory data analysis : Exploratory data analysis (EDA) is a powerful and simple tool that can be used to improve your understanding of your data, by exploring its properties. The technique is often applied when the goal is to create new hypotheses or find patterns in the data. It’s often used on large amounts of qualitative or quantitative data that haven’t been analyzed before.
- Benchmark : A benchmark model is the most user-friendly, dependable, transparent and interpretable model against which you can measure your own. It’s a good idea to run test data sets to see if your new machine learning model outperforms a recognized benchmark. These benchmarks are often used as measures for comparing the performance between different machine learning models like neural networks and support vector machines, linear and non-linear classifiers or different approaches like bagging and boosting.
Now, let’s have a look at why we need feature engineering in machine learning.
Importance of Feature Engineering
Feature engineering is a very important step in machine learning. Feature engineering refers to the process of designing artificial features into an algorithm. These artificial features are then used by that algorithm in order to improve its performance, or in other words, reap better results. Data scientists spend most of their time with data, and it becomes important to make models accurate.
When feature engineering activities are done correctly, the resulting data set is optimal and contains all of the important factors that affect the business problem. As a result of these data sets, the most accurate predictive models and the most useful insights are produced.
Feature Engineering Techniques for Machine Learning
Lets review a few feature engineering best techniques that you can use. Some of the techniques listed may work better with certain algorithms or data sets, while others may be useful in all situations.
1. Imputation
Missing values are one of the most common issues you’ll come across when it comes to preparing your data for machine learning. Human error, data flow interruptions, privacy concerns and other factors could all contribute to missing values. Missing values have an impact on the performance of machine learning models. The main goal of imputation is to handle these missing values. There are two types of imputation:
- Numerical imputation.
- Categorical imputation.
1. Numerical Imputation
To figure out what numbers should be assigned to people currently in the population, we usually use data from completed surveys or censuses. These data sets can include information about how many people eat different types of food, whether they live in a city or country with a cold climate and how much they earn every year. That is why numerical imputation is used to fill gaps in surveys or censuses when certain pieces of information are missing.
#Filling all missing values with 0
data = data.fillna(0)
2. Categorical Imputation
When dealing with categorical columns, replacing missing values with the highest value in the column is a smart solution. However, if you believe the values in the column are evenly distributed and there is no dominating value, imputing a category like “Other” would be a better choice, as your imputation is more likely to converge to a random selection in this scenario.
#Max fill function for categorical columns
data[‘column_name’].fillna(data[‘column_name’].value_counts().idxmax(), inplace=True)
2. Handling Outliers
Outlier handling is a technique for removing outliers from a data set. This method can be used on a variety of scales to produce a more accurate data representation. This has an impact on the model’s performance. Depending on the model, the effect could be large or minimal. For example, linear regression is particularly susceptible to outliers. This procedure should be completed prior to model training. The various methods of handling outliers include:
- Removal: Outlier-containing entries are deleted from the distribution. However, if there are outliers across numerous variables, this strategy may result in a big chunk of the datasheet being missed.
- Replacing values: Alternatively, the outliers could be handled as missing values and replaced with suitable imputation.
- Capping: Using an arbitrary value or a value from a variable distribution to replace the maximum and minimum values.
- Discretization : Discretization is the process of converting continuous variables, models, and functions into discrete ones. This is accomplished by constructing a series of continuous intervals (or bins) that span the range of our desired variable/model/function.
3. Log Transform
Log transform is the most used technique among data scientists. It’s mostly used to turn a skewed distribution into a normal or less-skewed distribution. We take the log of the values in a column and utilize those values as the column in this transform. It’s used to handle confusing data, and the data becomes more approximative to normal applications.
//Log Example
df[log_price] = np.log(df[‘Price’])
4. One-Hot Encoding
A one-hot encoding is a type of encoding in which an element of a finite set is represented by the index in that set, where only one element has its index set to “1” and all other elements are assigned indices within the range [0, n-1]. In contrast to binary encoding schemes, where each bit can represent two values (i.e. 0 and 1), this scheme assigns a unique value for each possible case.
5. Scaling
Feature scaling is one of the most pervasive and difficult problems in machine learning, yet it’s one of the most important things to get right. In order to train a predictive model, we need data with a known set of features that needs to be scaled up or down as appropriate. After a scaling operation, the continuous features become similar in terms of range. Although this step isn’t required for many algorithms, it’s still a good idea to do so. Distance-based algorithms like k-nearest neighbor and k-means, on the other hand, require scaled continuous features as model input. There are two common ways for scaling:
1. Normalization
All values are scaled in a specified range between 0 and 1 via normalization (or min-max normalization). This modification has no influence on the feature’s distribution, however, it does exacerbate the effects of outliers due to lower standard deviations. As a result, it’s advised that outliers be dealt with prior to normalization.
2. Standardization
Standardization, or z-score normalization, is the process of scaling values while accounting for standard deviation. If the standard deviation of features differs, the range of those features will differ. The effect of outliers in the characteristics is reduced as a result. To arrive at a distribution with a 0 mean and 1 variance, all the data points are subtracted by their mean and the result divided by the distribution’s variance.
Best Feature Engineering Tools to Know
There are many tools which will help you in automating the entire feature engineering process and producing a large pool of features in a short period of time for both classification and regression tasks. So, let’s have a look at some of the best feature engineering tools.
1. FeatureTools
FeatureTools is a framework to perform automated feature engineering. It excels at transforming temporal and relational data sets into feature matrices for machine learning. FeatureTools integrates with the machine learning pipeline-building tools you already have. You can load in Pandas DataFrames and automatically construct significant features in a fraction of the time it would take to do it manually.
FeatureTools Summary
- Easy to get started, good documentation and community support
- It helps you construct meaningful features for machine learning and predictive modeling by combining your raw data with what you know about your data.
- It provides APIs to verify that only legitimate data is utilized for calculations, preventing label leakage in your feature vectors.
- FeatureTools includes a low-level function library that may be layered to generate features.
- Its AutoML library(EvalML) helps you build, optimize and evaluate machine learning pipelines.
- Good at handling relational databases.
2. AutoFeat
AutoFeat helps to perform linear prediction models with automated feature engineering and selection. AutoFeat allows you to select the units of the input variables in order to avoid the construction of physically nonsensical features.
AutoFeat Summary
- AutoFeat can easily handle categorical features with one-hot encoding.
- The AutoFeatRegressor and AutoFeatClassifier models in this package have a similar interface to Scikit-learn models.
- General purpose automated feature engineering which isn’t good at handling relational data.
- It’s useful in logistical data.
3. TsFresh
TsFresh is a Python package. It automatically calculates a huge number of time series characteristics or features. In addition, the package includes methods for assessing the explanatory power and significance of such traits in regression and classification tasks.
TsFresh Summary
- Best open source python tool available for time series classification and regression.
- It helps to extract things such as the number of peaks, average value, maximum value, time reversal symmetry statistic, etc.
- It can be integrated with FeatureTools.
4. OneBM
OneBM interacts directly with a database’s raw tables. It slowly joins the tables, taking different paths on the relational tree. It recognizes simple data types like numerical or categorical, and complicated data types like set of numbers, set of categories, sequences, time series and texts in the joint results and applies pre-defined feature engineering approaches to the supplied types.
OneBM Summary
- Both relational and non-relational data are supported.
- When compared to FeatureTools, it generates both simple and complicated features.
- It was put to the test in Kaggle competitions, and it outperformed state-of-the-art models.
5. ExploreKit
Based on the idea that extremely informative features are typically the consequence of manipulating basic ones, ExploreKit identifies common operators to alter each feature independently or combine multiple of them. Instead of running feature selection on all developed features, which can be quite huge, meta learning is used to rank candidate features.
Advantages of Feature Engineering
Feature engineering is the development of new data features from raw data. With this technique, engineers analyze the raw data and potential information in order to extract a new or more valuable set of features. Feature engineering can be seen as a generalization of mathematical optimization that allows for better analysis. Hope you learned about feature engineering, its techniques and tools used by engineers.