
 in Python")
Data preparation and exploratory data analysis (EDA) take a lot of time and effort from data professionals. Wouldn’t it be nice to have a package that enables you to explore your data quickly — in just one line of code?
I’ll show you the best four Python packages that can automate your data exploration and analysis. I’ll go through each one, what it does and how you can use it.
What Is Exploratory Data Analysis (EDA)?
Before diving into Python packages, let’s revisit what we mean by exploratory data analysis. EDA is the process of reviewing data to discover the main patterns in a data set. Data analysts can then leverage these data-driven insights to understand relationships between variables, pinpoint anomalies, verify hypotheses and complete other tasks.
Exploratory data analysis often involves developing data visualizations like scatter plots, histograms and box plots to spot trends. But the process is simpler with Python, which offers several packages that can conduct EDA and deliver faster results.
4 Ways to Automate Your Exploratory Data Analysis in Python
- DataPrep
- Pandas Profiling
- SweetViz
- AutoViz
1. DataPrep
DataPrep lets you prepare your data using a single library with a few lines of code. The DataPrep ecosystem currently consists of three components:
- Connector
- EDA
- Clean API
The connector enables a simple data collection from web APIs by providing a standard set of operations. The EDA component handles the exploratory data analysis, and clean API provides functions for efficiently cleaning and validating data.
For example, using the Philly parking violations data set, we can call plot() to get an overview of EDA on the data frame or plot correlations with a single line of code, using plot_correlations().
You can also generate a detailed report with one line of code using DataPrep. Here’s a create_report() method called on a data frame.
import pandas as pd
from dataprep.eda import create_report
df = pd.read_csv("parking_violations.csv")
create_report(df)
You’ll get back an extensive and interactive report for variables and correlations as well as interactions and missing values.
DataPrep eases the amount and effort you need as a data scientist to explore the data set. With just one line of code, you can get an overview of your data set, missing values, correlations and statistical description of the data set, as you can see above.
To install DataPrep, run:
pip install dataprepCheck out the DataPrep documentation for more information.
2. Pandas Profiling
Pandas Profiling generates profile reports from a Pandas DataFrame and enables you to perform similar kinds of EDA to the other packages I’m discussing here. It has an extensive use case and more tutorials than all of the packages.
With just one line of code, you can generate an EDA report using Pandas Profiling with descriptive statistics, correlations, missing value, text analysis and more.
Let us call ProfileReport() on the Philly data frame to generate an EDA report.
from pandas_profiling import ProfileReport
profile = ProfileReport(df, title="Report")
profile
Pandas Profiling generates a similar report with a sleek user interface (UI).
You can install using the pip package manager by running:
pip install pandas-profiling[notebook]Make sure to visit the GitHub repository for more tutorials and documentation.
3. SweetViz
SweetViz offers an in-depth EDA (target analysis, comparison, feature analysis, correlation) and interactive EDA in two lines of code! In addition, SweetViz allows you to compare two data sets, such as training and test data sets for your machine learning projects.
To get a report from SweetViz, you can run the following command on any data frame and it will generate an HTML report.
import sweetviz as sv
analyze_report = sv.analyze(df)
analyze_report.show_html(report.html', open_browser=False)
4. AutoViz
With AutoViz, you can automatically visualize any size data set with a single line of code in much more detail. Here’s a report generated with AutoViz using the Philly parking data set.
from autoviz.AutoViz_Class import AutoViz_Class
AV = AutoViz_Class()
df_av = AV.AutoViz('parking.csv')
Note that you don’t even need Pandas to read the data. AutoViz will load it when you provide the path to the data set. Here’s the report we generated with AutoViz.
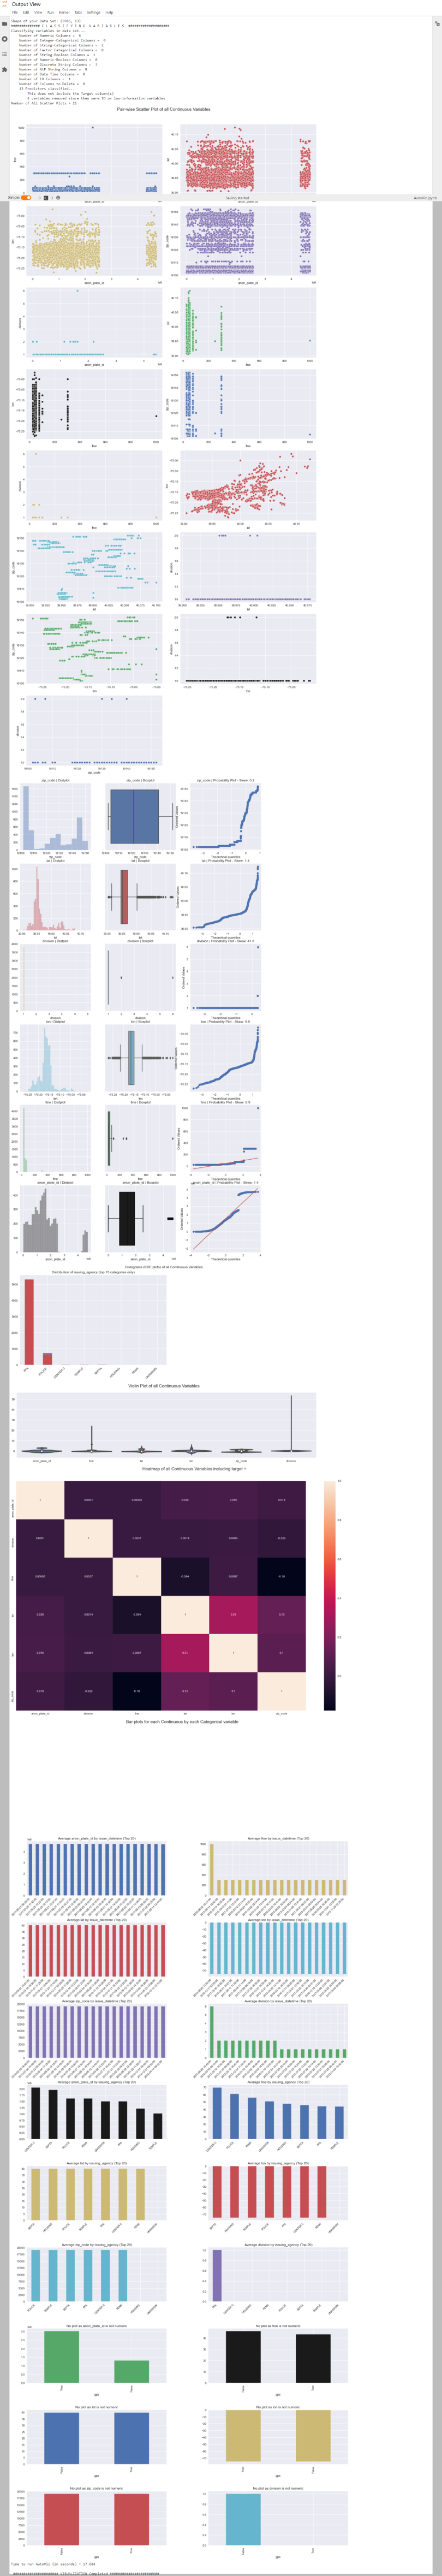
In AutoViz, you have many more plots (i.e., violin, boxplots and more) as well as statistical and probability values. However, the UI isn’t as neat as others’ reports, and you don’t have access to interactive plots.
To install AutoViz, run the following command:
pip install autoviz
The Takeaway
The four packages offer similar functionalities that allow you to automate your EDA with simple, intuitive code (often just one line of it!).
That said, of the four packages in this article, DataPrep provides much more functionality than simple EDA. It can help you ingest more data sources and can help you get through large data sets faster.
In addition, the clean API in DataPrep can help you clean your data set without many hurdles.
Frequently Asked Questions
What is EDA in Python?
EDA involves analyzing data to find patterns that can be used to verify hypotheses, detect anomalies and complete other actions. Although data visualizations like box plots and scatter plots are used to conduct EDA, Python packages can automate the entire process and quickly extract insights from data sets.
Which package is best for EDA in Python?
DataPrep stands out due to its functionality, clean API and ability to handle larger data sets. That said, choosing a Python package may depend on a user’s circumstances and what they’re trying to accomplish.


