

The Shapiro-Wilk test checks whether a sample comes from a normal distribution. Its null hypothesis assumes normality; a low p-value indicates a deviation from that assumption.
Data scientists usually have to check if data is normally distributed. An example is the normality check on the residuals of linear regression in order to correctly use the F-test — and one way to check for normality is through the Shapiro-Wilk test.
Shapiro-Wilk Test Explained
Shapiro-Wilk test is a hypothesis test that evaluates whether a data set is normally distributed. It evaluates data from a sample with the null hypothesis that the data set is normally distributed. A large p-value indicates the data set is normally distributed, a low p-value indicates that it isn’t normally distributed.
Let’s see how we can check the normality of a data set.
What Is Normality?
Normality means that a particular sample has been generated from a Gaussian distribution. It doesn’t necessarily have to be a standardized normal distribution, with a zero mean and a variance equal to one.
There are several situations in which data scientists may need normally distributed data:
- To compare the residuals of linear regression in the training test with the residuals in the test set using an F-test.
- To compare the mean value of a variable across different groups using a one-way analysis of variance (ANOVA) test or a student’s t-test.
- To assess the linear correlation between two variables using a proper test on their Pearson’s correlation coefficient.
- To assess if the likelihood of a feature against a target in a Naive Bayes model allows us to use a Gaussian Naive Bayes classification model.
These are all different examples that may occur frequently in a data scientist’s everyday job.
Unfortunately, data is not always normally distributed. In these cases, transformations such as the Box-Cox or Yeo-Johnson methods can help make the distribution more symmetrical.
A good way to assess the normality of a data set would be to use a Q-Q plot, which gives us a graphical visualization of normality. But we often need a quantitative result to check and a chart couldn’t be enough. That’s why we can use a hypothesis test to assess the normality of a sample.
What Is the Shapiro-Wilk Test?
The Shapiro-Wilk test is a hypothesis test that is applied to a sample with a null hypothesis that the sample has been generated from a normal distribution. If the p-value is low, we can reject such a null hypothesis and say that the sample has not been generated from a normal distribution.
It’s a widely-used statistical tool that can help us find an answer to the normality check we need, but it has one flaw: It doesn’t work well with large data sets. The maximum allowed size for a data set depends on the implementation. For example, for samples larger than 5,000, the Shapiro-Wilk test with SciPy in Python still runs, but it issues a warning that the p-value may not be accurate due to limitations in the test’s underlying assumptions.
However, this test is still a very powerful tool we can use. Let’s see a practical example in Python.
Shapiro-Wilk Test Example in Python
First of all, let’s import NumPy and Matplotlib.
import numpy as np import
matplotlib.pyplot as plt
Now, we have to import the function that calculates the p-value of a Shapiro-Wilk test. It’s the “shapiro” function in scipy.stats.
from scipy.stats import shapiroLet’s now simulate two data sets, one generated from a normal distribution and the other generated from a uniform distribution.
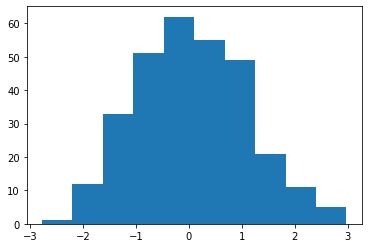
x = np.random.normal(size=300)
y = np.random.uniform(size=300)
This is the histogram for “x”:
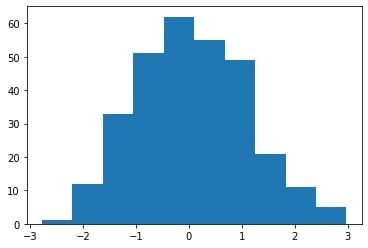
We can clearly see that the distribution is very similar to a normal distribution.
And this is the histogram for “y”:
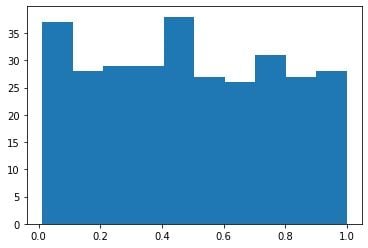
As expected, the distribution is very far from a normal one.
So, we expect a Shapiro-Wilk test to give us a pretty large p-value for the “x” sample and a small p-value for the “y” sample, because it’s not normally distributed.
Let’s calculate such p-values:
shapiro(x)
# ShapiroResult(statistic=0.9944895505905151, pvalue=0.35326337814331055)
As we can see, the p-value for the “x” sample is not low enough for us to reject the null hypothesis.
If we calculate the p-value on “y,” we get a different result.
shapiro(y)
# ShapiroResult(statistic=0.9485685229301453, pvalue=9.571677672681744e-09)
The p-value is lower than 5 percent, so we can reject the null hypothesis of the normality of the data set.
If we try to calculate the p-value on a sample larger than 5,000 points, we get a warning:
shapiro(np.random.uniform(size=6000))
# /usr/local/lib/python3.7/dist-packages/scipy/stats/morestats.py:1760:
# UserWarning: p-value may not be accurate for N > 5000.
# warnings.warn("p-value may not be accurate for N > 5000.")
# ShapiroResult(statistic=0.9526152014732361, pvalue=2.6791145079733313e-40)
So, that’s how we can perform the Shapiro-Wilk test for normality in Python. Just make sure to use a properly shaped data set so that you don’t have to work with approximated p-values.
Advantages of the Shapiro-Wilk Test
The Shapiro-Wilk test for normality is a very simple-to-use tool of statistics to assess the normality of a data set. I typically apply it after creating a data visualization set either via a histogram and/or a Q-Q plot. It’s a very useful tool to ensure that a normality requirement is satisfied every time we need it, and it must be present in every data scientist’s toolbox.
Frequently Asked Questions
What does a Shapiro-Wilk test tell you?
A Shapiro-Wilk test tells whether a data set is normally distributed. The Shapiro-Wilk test is a hypothesis test that is applied to a data sample with a null hypothesis that the sample has a normal distribution. In this test, a high p-value indicates the data set has a normal distribution, while a low p-value indicates that it does not have a normal distribution.
What is the difference between the t-test and the Shapiro-Wilk test?
In statistics, a t-test is used to compare the means of two groups of data and determine if they have a significant difference, while a Shapiro-Wilk test is used to determine if a data set follows a normal distribution.
The Shapiro-Wilk test is often used before conducting a t-test to ensure the assumption of normality is met.
When should I use Shapiro Wilk?
A Shapiro-Wilk test can be used to check whether a data set has a normal distribution, and is most effective on small data sets or small sample sizes.


