

Statistical analysis is a technique we use to find patterns in data and make inferences about those patterns to describe variability in the results of a data set or an experiment.
In its simplest form, statistical analysis answers questions about:
- Quantification — how big/small/tall/wide is it?
- Variability — growth, increase, decline
- The confidence level of these variabilities
What Are the 2 Types of Statistical Analysis?
- Descriptive Statistics: Descriptive statistical analysis summarizes a data set using its characteristics, including measures of central tendency, dispersion and distribution.
- Inferential Statistics: Inferential statistical analysis allows you to draw conclusions from your sample data set and make predictions about a population using statistical tests.
What’s the Purpose of Statistical Analysis?
Using statistical analysis, you can determine trends in the data by calculating your data set’s mean or median. You can also analyze the variation between different data points from the mean to get the standard deviation. Furthermore, to test the validity of your statistical analysis conclusions, you can use hypothesis testing techniques, like P-value, to determine the likelihood that the observed variability could have occurred by chance.
Types of Statistical Analysis
There are two major types of statistical data analysis: descriptive and inferential.
Descriptive Statistical Analysis
Descriptive statistical analysis summarizes a data set using its characteristics, including measures of central tendency, dispersion and distribution.
Within the descriptive analysis branch, there are two main types: measures of central tendency (i.e. mean, median and mode) and measures of dispersion or variation (i.e. variance, standard deviation and range).
For example, you can calculate the average exam results in a class using central tendency or, in particular, the mean. In that case, you’d sum all student results and divide by the number of tests. You can also calculate the data set’s spread by calculating the variance. To calculate population variance, subtract each exam result in the data set from the mean, square the answer, add everything together and divide by the number of tests. If working with a sample, divide by (n – 1) instead of n to get an unbiased estimate.
Inferential Statistics
On the other hand, inferential statistical analysis allows you to draw conclusions from your sample data set and make predictions about a larger population using statistical tests.
There are two main types of inferential statistical analysis: hypothesis testing and regression analysis.
We use hypothesis testing to test and validate assumptions in order to draw conclusions about a population from the sample data. These include formal hypothesis tests such as the Z-test, F-Test, ANOVA test, as well as tools like confidence intervals for estimating population parameters.
On the other hand, regression analysis primarily estimates the relationship between a dependent variable and one or more independent variables. There are numerous types of regression analysis but the most popular ones include linear and logistic regression.
Statistical Analysis Steps
In the era of big data and data science, there is a rising demand for a more problem-driven approach. As a result, we must approach statistical analysis holistically. We may divide the entire process into five different and significant stages by using the well-known PPDAC model of statistics: Problem, Plan, Data, Analysis and Conclusion.
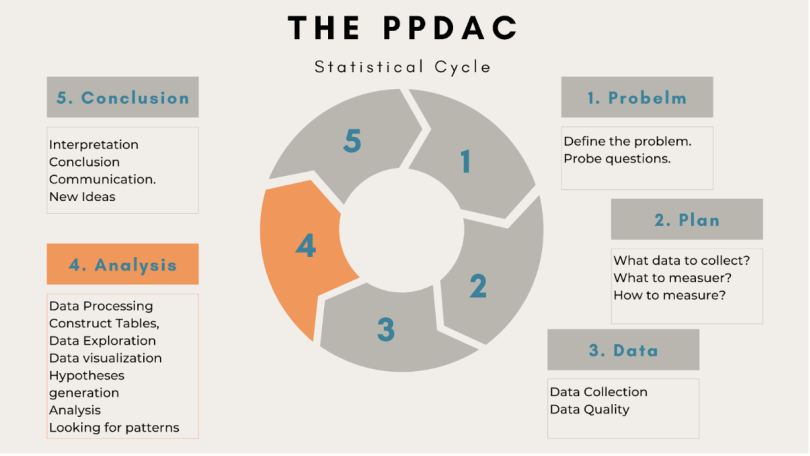
1. Problem
In the first stage, you define the problem you want to tackle and explore questions about the problem.
2. Plan
Next is the planning phase. You can check whether data is available or if you need to collect data for your problem. You also determine what to measure and how to measure it.
3. Data
The third stage involves data collection, understanding the data and checking its quality (i.e. accuracy, validity and completeness).
4. Analysis
Statistical data analysis is the fourth stage. Here you process and explore the data with the help of tables, graphs and other data visualizations. You also develop and scrutinize your hypothesis in this stage of analysis.
5. Conclusion
The final step involves interpretations and conclusions from your analysis. It also covers generating new ideas for the next iteration. Thus, statistical analysis is not a one-time event but an iterative process.
Statistical Analysis Uses
Statistical analysis is useful for research and decision making because it allows us to understand the world around us and draw conclusions from information by testing our assumptions. Statistical analysis is important for various applications, including:
- Statistical quality control and analysis in product development
- Clinical trials
- Customer satisfaction surveys and customer experience research
- Marketing operations management
- Process improvement and optimization
- Training needs
Benefits of Statistical Analysis
Here are some of the reasons why statistical analysis is widespread in many applications and why it’s necessary:
Understand Data
Statistical analysis gives you a better understanding of the data and what they mean. These types of analyses provide information that would otherwise be difficult to obtain by merely looking at the numbers without considering their relationship.
Test for Causal Relationships
Statistical analysis can help identify associations and, with proper experimental design, test for causal relationships, like when you’re looking for a relationship between two variables.
Make Data-Informed Decisions
Businesses are constantly looking to find ways to improve their services and products. Statistical analysis allows you to make data-informed decisions about your business or future actions by helping you identify trends in your data, whether positive or negative.
Determine Probability
Statistical methods allow us to calculate the probability of observed outcomes and determine the reliability of our conclusions. For example, it can help scientists and engineers decide how much confidence they can have in the results of their research, how to interpret their data and what questions they can feasibly answer.
What Are the Risks of Statistical Analysis?
Statistical analysis can be valuable and effective, but it’s an imperfect approach. Even if the analyst or researcher performs a thorough statistical analysis, there may still be known or unknown problems that can affect the results. Therefore, statistical analysis is not a one-size-fits-all process. If you want to get good results, you need to know what you’re doing. It can take a lot of time to figure out which type of statistical analysis will work best for your situation.
Thus, you should remember that our conclusions drawn from statistical analysis don’t always guarantee correct results. This can be dangerous when making business decisions. In marketing, for example, we may come to the wrong conclusion about a product. Therefore, the conclusions we draw from statistical data analysis are often approximated; testing for all factors affecting an observation is impossible.
Frequently Asked Questions
What is statistical analysis used for?
Statistical analysis is the process of collecting and analyzing data to identify patterns in data, pull data insights and make data-driven predictions. It's largely used to support decision-making in fields like product development, healthcare and marketing.
What are the main types of statistical analysis?
The two main types of statistical analysis are descriptive statistics (which summarizes the characteristics of given data) and inferential statistics (which draws conclusions about a larger population from given sample data).
What are the steps in statistical analysis?
Statistical analysis typically follows the PPDAC model, where the steps are as follows:
- Problem
- Plan
- Data
- Analysis
- Conclusion


