In some pattern recognition problems, the training data consists of a set of input vectors x, without any corresponding target values. Unsupervised clustering attempts to group similar data points into clusters to determine how the data is distributed in the space, known as density estimation. This is the core of unsupervised learning.
Unsupervised Clustering Defined
Unsupervised clustering is an unsupervised learning process in which data points are put into clusters to determine how the data is distributed in space. This density estimation allows the algorithm to label and classify data, which is what powers unsupervised learning algorithms. There are four common unsupervised clustering algorithms: k-means clustering, fuzzy k-means clustering, hierarchical clustering and mixture of gaussians.
In mathematical terms, for n-sampled space x1 to xn, true class labels are not provided for each sample. That’s why it’s known as learning without a teacher. As a result, unsupervised clustering enables AI to learn without human supervision.
What Is Unsupervised Clustering?
Clustering can be considered the most important unsupervised learning problem. It deals with finding a structure in a collection of unlabeled data. A loose definition of clustering could be the process of organizing objects into groups whose members are similar in some way. A cluster is therefore a collection of objects that are similar between them and are dissimilar to the objects belonging to other clusters.
Distance-Based Clustering
Given a set of points, with a notion of distance between points, grouping the points into some number of clusters, such that:
- Internal (within the cluster) distances should be small, i.e members of clusters are close/similar to each other.
- External (intra-cluster) distances should be large, i.e. members of different clusters are dissimilar.
How Unsupervised Clustering Works
The goal of clustering is to determine the internal grouping in a set of unlabeled data. But how do you decide what constitutes good clustering? There is no absolute “best” criterion that would be independent of the final aim of the clustering. Consequently, it is the user who should supply this criterion, in such a way that the result of the clustering will suit their needs.
To find a particular clustering solution, we need to define the similarity measures for the clusters.
Proximity Measures
For clustering, we need to define a proximity measure for two data points. Proximity here means how similar/dissimilar the samples are with respect to each other.
- Similarity measure S(xi,xk): Large if xi,xk are similar.
- Dissimilarity (or distance) measure D(xi,xk): Small if xi,xk are similar.
There are various similarity measures that can be used.
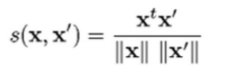
- Vectors: Cosine distance
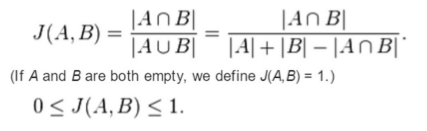
- Sets: Jaccard distance
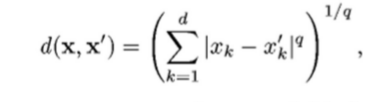
- Points: Euclidean distance
q=2
A good proximity measure is application dependent. The clusters should be invariant under the transformations natural to the problem. Also, while clustering, it is not advised to normalize data that are drawn from multiple distributions.
Types of Unsupervised Clustering Algorithms
Unsupervised clustering algorithms are classified into four different types:
- Exclusive clustering
- Overlapping clustering
- Hierarchical clustering
- Probabilistic clustering
In exclusive clustering, data are grouped in an exclusive way, so that if a certain data point belongs to a definite cluster, then it could not be included in another cluster. A simple example is a graph where the separation of data points is achieved by a straight line on a bi-dimensional plane.
Overlapping clustering uses fuzzy sets to cluster data, so that each point may belong to two or more clusters with different degrees of membership. In this case, data will be associated with an appropriate membership value.
A hierarchical clustering algorithm is based on the union between the two nearest clusters. The beginning condition is realized by setting every data point as a cluster. After a few iterations it reaches the final clusters wanted.
Finally, the last kind of clustering uses a completely probabilistic approach.
We will talk about four of the most used clustering algorithms:
- K-means
- Fuzzy k-means
- Hierarchical clustering
- Mixture of gaussians
Each of these algorithms belongs to one of the clustering types listed above. K-means is an exclusive clustering algorithm, fuzzy K-means is an overlapping clustering algorithm, hierarchical clustering is obvious and lastly, mixture of gaussians is a probabilistic clustering algorithm.
1. K-Means Clustering
K-means is one of the simplest unsupervised learning algorithms that solves the well known clustering problem. The procedure follows a simple and easy way to classify a given data set through a certain number of clusters, assume k clusters, fixed a priori. The main idea is to define k centers, one for each cluster. These centroids should be placed in a smart way, as different locations will create different results. So, the best choice is to place them as far away from each other as possible.
The next step is to take each point belonging to a given data set and associate it to the nearest centroid. When no point is pending, the first step is completed and an early groupage is done. At this point we need to recalculate k new centroids as barycenters of the clusters resulting from the previous step. After we have these k new centroids, a new binding has to be done between the same data set points and the nearest new centroid. A loop has been generated. As a result of this loop, we may notice that the k centroids change their location step by step until no more changes are done. In other words centroids do not move any more.
Finally, this algorithm aims at minimizing an objective function, in this case a squared error function. The objective function

Where:

Is a chosen distance measure between a data point xi and the cluster center cj, is an indicator of the distance of the n data points from their respective cluster centers.
The algorithm is composed of the following steps:
- Let X = {x1,x2,x3,……..,xn} be the set of data points and V = {v1,v2,…….,vc} be the set of centers.
- Randomly select ‘c’ cluster centers.
- Calculate the distance between each data point and cluster centers.
- Assign the data point to the cluster center whose distance from the cluster center is the minimum of all the cluster centers.
- Recalculate the new cluster center using:
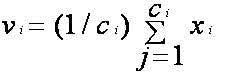
Where, ‘ci’ represents the number of data points in ith cluster.
- Recalculate the distance between each data point and new obtained cluster centers.
- If no data point was reassigned then stop, otherwise repeat step 3.
Although it can be proved that the procedure will always terminate, the k-means algorithm does not necessarily find the most optimal configuration, corresponding to the global objective function minimum. The algorithm is also significantly sensitive to the initial randomly selected cluster centers. The k-means algorithm can be run multiple times to reduce this effect.
K-means is a simple algorithm that has been adapted to many problem domains. As we are going to see, it is a good candidate for extension to work with fuzzy feature vectors.
The k-means procedure can be viewed as a greedy algorithm for partitioning the n samples into k clusters so as to minimize the sum of the squared distances to the cluster centers. It does have some weaknesses:
- The way to initialize the means was not specified. One popular way to start is to randomly choose k of the samples.
- It can happen that the set of samples closest to mi is empty, so that mi can’t be updated. This is a problem that needs to be handled during the implementation, but is generally ignored.
- The results depend on the value of k and there is no optimal way to describe a “best k.”
This last problem is particularly troublesome, since we often have no way of knowing how many clusters exist. In the example shown above, the same algorithm applied to the same data produces the following three-means clustering. Is it better or worse than the two-means clustering?
Unfortunately, there is no general theoretical solution to find the optimal number of clusters for any given data set. A simple approach is to compare the results of multiple runs with different k classes and choose the best one according to a given criterion, but we need to be careful because increasing k results in smaller error function values by definition, but also increases the risk of overfitting.
2. Fuzzy K-Means Clustering
In fuzzy clustering, each point has a probability of belonging to each cluster, rather than completely belonging to just one cluster as is the case in the traditional k-means. Fuzzy k-means specifically tries to deal with the problem where points are somewhat in between centers, or otherwise ambiguous, by replacing distance with probability. This could be some function of distance, such as having probability relative to the inverse of the distance.
Fuzzy k-means uses a weighted centroid based on those probabilities. Processes of initialization, iteration, and termination are the same as the ones used in k-means. The resulting clusters are best analyzed as probabilistic distributions rather than a hard assignment of labels. K-means is a special case of fuzzy k-means when the probability function used is simply one, if the data point is closest to a centroid, and zero otherwise.
The fuzzy k-means algorithm is the following:
- Assume a fixed number of clusters K.
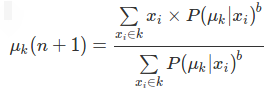
- Initialization: Randomly initialize the k-means μk associated with the clusters and compute the probability that each data point Xi is a member of a given cluster K,
P(PointXiHasLabelK|Xi,K). - Iteration: Recalculate the centroid of the cluster as the weighted centroid given the probabilities of membership of all data points Xi:
- Termination: Iterate until convergence or until a user-specified number of iterations has been reached. The iteration may be trapped at some local maxima or minima.
In the fuzzy k-means approach, instead, a given data point does not belong exclusively to a well defined cluster, but it can be placed in the middle. In this case, the membership function follows a smoother line to indicate that every data point may belong to several clusters with different extent of membership.
3. Hierarchical Clustering Algorithms
Given a set of N items to be clustered, and an N*N distance (or similarity) matrix, the basic process of hierarchical clustering is this:
- Start by assigning each item to a cluster, so that if you have N items, you now have N clusters, each containing just one item. Let the distances (similarities) between the clusters the same as the distances (similarities) between the items they contain.
- Find the closest, or most similar, pair of clusters and merge them into a single cluster, so that you now have one cluster less.
- Compute distances (similarities) between the new cluster and each of the old clusters.
- Repeat steps two and three until all items are clustered into a single cluster of size N.
4. Clustering as a Mixture of Gaussians
There’s another way to deal with clustering problems: a model-based approach, which consists in using certain models for clusters and attempting to optimize the fit between the data and the model.
In practice, each cluster can be mathematically represented by a parametric distribution, like a Gaussian. The entire data set is modeled by a mixture of these distributions. A mixture model with high likelihood tends to have the following traits:
- Component distributions have high “peaks,” where data in one cluster are tight;
- The mixture model covers the data well. This means dominant patterns in the data are captured by component distributions.
Main advantages of model-based clustering:
- Well-studied statistical inference techniques available.
- Flexibility in choosing the component distribution.
- Obtain a density estimation for each cluster.
- A “soft” classification is available.
Mixture of Gaussians
The most widely used clustering method of this kind is based on learning a mixture of Gaussians:
A mixture model is a mixture of k component distributions that collectively make a mixture distribution f(x):
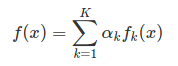
The αk represents the contribution of the kth component in constructing f(x). In practice, parametric distribution (e.g. gaussians), are often used since a lot work has been done to understand their behavior. If you substitute each fk(x) for a gaussian you get what is known as a gaussian mixture models (GMM).
The Expectation-Maximization Algorithm
Expectation-maximization assumes that your data is composed of multiple multivariate normal distributions. This is a very strong assumption, in particular, when you fix the number of clusters. EM is an algorithm for maximizing a likelihood function when some of the variables in your model are unobserved, i.e., when you have latent variables.
You might ask if we’re just trying to maximize a function, why don’t we just use the existing machinery for maximizing a function. Well, if you try to maximize this by taking derivatives and setting them to zero, you find that in many cases the first-order conditions don’t have a solution. There’s a chicken-and-egg problem in that to solve for your model parameters you need to know the distribution of your unobserved data, but the distribution of your unobserved data is a function of your model parameters.
Expectation-maximization tries to get around this by iteratively guessing a distribution for the unobserved data, then estimating the model parameters by maximizing something that is a lower bound on the actual likelihood function, and repeating until convergence:
The expectation-maximization algorithm:
- Start with a guess for values of your model parameters.
- Expectation step: For each datapoint that has missing values, use your model equation to solve for the distribution of the missing data given your current guess of the model parameters and given the observed data. You are solving for a distribution for each missing value, not for the expected value. Now that we have a distribution for each missing value, we can calculate the expectation of the likelihood function with respect to the unobserved variables. If our guess for the model parameter was correct, this expected likelihood will be the actual likelihood of our observed data; if the parameters were not correct, it will just be a lower bound.
- M-step: Now that we’ve got an expected likelihood function with no unobserved variables in it, maximize the function as you would in the fully observed case, to get a new estimate of your model parameters.
- Repeat until convergence.
Unsupervised Clustering Advantages and Disadvantages
- Annotating large data sets is very costly, and we can only label a few examples manually. This occurs in speech recognition.
- There may be cases where we don’t know how many or what classes the data is divided into. This can occur in data mining
- We may want to use clustering to gain some insight into the structure of the data before designing a classifier.
There are a number of problems with clustering. Among them:
- Dealing with large number of dimensions and large number of data items can be problematic because of time complexity;
- The effectiveness of the method depends on the definition of “distance,” for distance-based clustering). If an obvious distance measure doesn’t exist we must “define” it, which is not always easy, especially in multidimensional spaces;
- The result of the clustering algorithm that in many cases, can be arbitrary itself, can be interpreted in different ways.
Unsupervised Clustering Applications
Clustering algorithms can be applied in many fields, for instance:
- Marketing: Finding groups of customers with similar behavior given a large database of customer data containing their properties and past buying records.
- Biology: Classification of plants and animals given their features.
- Insurance: Identifying groups of motor insurance policy holders with a high average claim cost; identifying frauds.
- Earthquake studies: Clustering observed earthquake epicenters to identify dangerous zones.
- Internet: Document classification, clustering web log data to discover groups of similar access patterns.
Frequently Asked Questions
Is clustering supervised or unsupervised?
Clustering is an unsupervised learning process. It attempts to group similar data points into clusters to determine how the data is distributed in the space. Those data groups become labeled, which is the core of unsupervised learning.
Is k-means clustering unsupervised?
K-means clustering is an unsupervised clustering algorithm. The algorithm establishes k centroids for each data cluster. Each point is associated with the nearest centroid. When no point is pending, the first step is completed and an early grouping is done. At this point, new k centroids are established and the process continues. K-means is a good candidate for extension to work with fuzzy feature vectors.