Explained")
If you’ve encountered the PASCAL Visual Object Classes (VOC) and MS Common Objects in Context (COCO) challenge, or dabbled with projects involving information retrieval and re-identification (ReID), you might be quite familiar with a metric called mean average precision (mAP). The mean average precision or sometimes simply just referred to as average precision is a popular metric used to measure the performance of models doing document/information retrieval and object detection tasks.
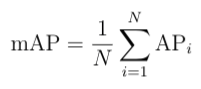
The equation for the mean average precision (mAP) of a set of queries is:
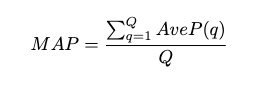
Where Q is the number of queries in the set and AveP(q) is the average precision (AP) for a given query, q.
What the formula is essentially telling us is that, for a given query, q, we calculate its corresponding AP, and then the mean of all these AP scores would give us a single number, called the mAP. This quantifies how good our model is at performing the query.
Mean Average Precision Definition
Mean average precision calculates the performance of object detection and information retrieval models. The equation takes the mean of all average precision scores to quantify how effective the model is at performing a given query.
This definition baffles people (like me) who are just starting out in this field. I had questions like what is this set of queries? And what does AP mean? Is it just an average of the precision?
This article hopes to address these questions and calculate mAP for both object detection and information retrieval tasks. We’ll also be exploring why mAP is an appropriate and commonly used metric for information retrieval and object detection tasks.
What Is Mean Average Precision?
As we discussed, mean average precision evaluates how good a model is at performing a query. To better understand how it works, it’s important to review precision and recall, two commonly used metrics to judge the performance of a given classification model.
Precision and Recall in Data Science
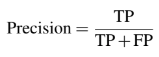
In statistics, data science, and machine learning, precision of a given class in classification, or positive predictive value, is given as the ratio of true positive (TP) and the total number of predicted positives. The formula is given as such:
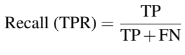
Similarly, the recall, true positive rate or sensitivity, of a given class in classification, is defined as the ratio of true positive and total of ground truth positives. The formula is given as such:
Just by looking at the formulas, we could suspect that for a given classification model, there lies a trade-off between its precision and recall performance. If we are using a neural network, this trade-off can be adjusted by the model’s final layer softmax threshold.
For our precision to be high, we would need to decrease our number of false positives. But by doing so, it would decrease our recall. Similarly, by decreasing our number of false negatives would increase our recall and decrease our precision. Very often for information retrieval and object detection cases, we would want our precision to be high (our predicted positives to be TP).
Precision and recall are commonly used along with other metrics such as accuracy, F1-score, specificity or true negative rate (TNR), receiver operating characteristics (ROC), lift and gain.
Precision and Recall in Information Retrieval
However, when it comes to information retrieval, the definition is different.
Precision represents the ratio of relevant documents the model retrieves based on a user’s query over the total number of retrieved documents.
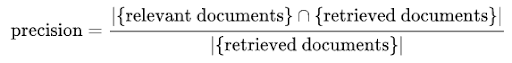
Keeping the nomenclature similar to the formula defined above, a relevant document can be regarded as a TP.
By default, precision takes all the retrieved documents into account, but it can also be evaluated at a given number of retrieved documents, commonly known as cut-off rank, where the model is only assessed by considering its top-most queries. The measure is called precision at k or P@K.
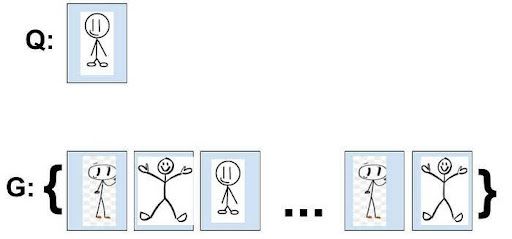
Let’s use an example to better understand the formula.
What Is a Retrieval Task?
A typical task in information retrieval is for a user to provide a query to a database and retrieve information similar to the query. Let’s now perform a calculation for precision with an example with three ground truth positives (GTP). Ground truth positives are the labeled-as-positive data. In other words, the relevant documents.
We shall define the following variables:
- Q is the user query.
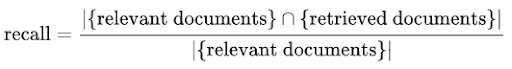
- G is a set of labeled data in the database.
- d(i,j) is the score function to show how similar object i is to j.
- G’ which an ordered set of G according to score function d( , ).
- k to be the index of G’.
After calculating the d( , ) for each of the documents with Q, we can sort G and get G’.
Say the model returns the following G’:

Using the Precision formula above, we get the following:
- P@1 = 1/1 = 1
- P@2 = 1/2 = 0.5
- P@3 = 1/3 = 0.33
- P@4 = 2/4 = 0.5
- P@5 = 3/5 = 0.6
- P@n = 3/n
Similarly, the recall formula is given as the ratio retrieved documents that are relevant to a user’s query over the relevant documents.
Recall in this case is not as useful as returning all the documents for a query will result in a trivial 100 percent recall, hence recall by itself is commonly not used as a metric.
How to Calculate Mean Average Precision for Information Retrieval
Being familiar with precision@k, we can now move on to calculate the average precision. This would give us a better measurement of our model in its ability to sort the results of the query, G’.

Where GTP refers to the total number of ground truth positives, n refers to the total number of documents you are interested in, P@k refers to the precision@k and rel@k is a relevance function. The relevance function is an indicator function that equals 1 if the document at rank k is relevant and equals to 0 otherwise.
Recalling the definition of precision, we shall now use it to calculate the AP for each document in G’. Using the same example shown above:
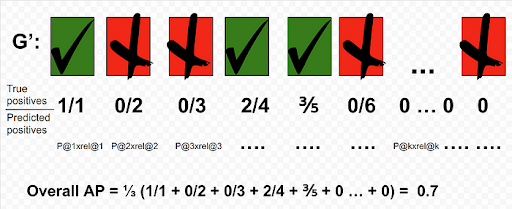
The overall AP for this query is 0.7. One thing to note is that since we know that there are only three GTP, the AP@5 would equal the overall AP.
For another query, Q, we could get a perfect AP of 1 if the returned G’ is sorted as such:
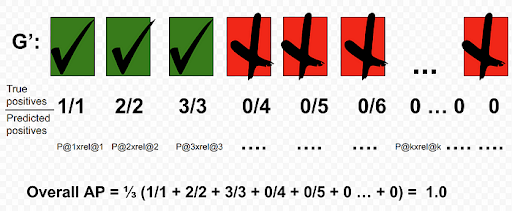
What AP does, in this case, is to penalize models that are not able to sort G’ with TPs leading the set. It provides a number that is able to quantify the goodness of the sort based on the score function d( , ). By dividing the sum of precision with the total GTP instead of dividing by the length of G’ allows a better representation for queries that only have a few GTP.
Calculating Mean Average Precision
For each query, Q, we can calculate a corresponding AP. A user can have as many queries as they like against this labeled database. The mAP is simply the mean of all the queries that the user made.
Mean Average Precision for Object Detection
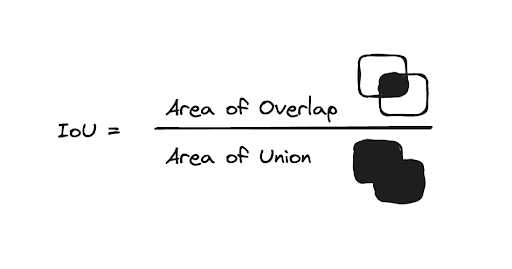
Intersection over Union (IoU)
Calculating AP (Traditional IoU = 0.5)
To do the calculation of AP for object detection, we would first need to understand IoU. The IoU is given by the ratio of the area of intersection and area of union of the predicted bounding box and ground truth bounding box.
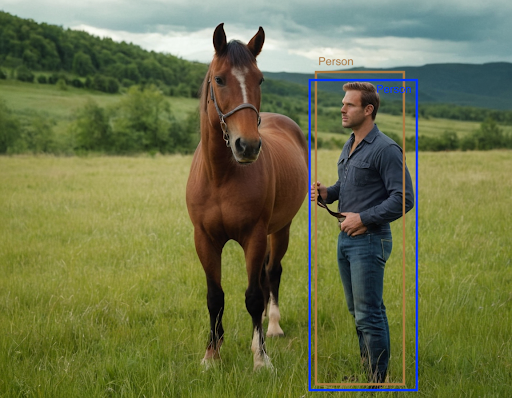
The IoU would be used to determine if a predicted bounding box (BB) is TP, FP or FN. The TN is not evaluated as each image is assumed to have an object in it. Let’s consider the following image with:

The image contains a person and horse with their corresponding ground truth bounding boxes. We’ll ignore the horse for the moment. We’ll run our object detection model on this image and receive a predicted bounding box for the person. Traditionally, we define a prediction to be a TP if the IoU is > 0.5. The possible scenarios are described below:
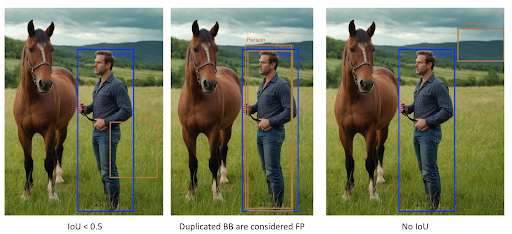
1. True Positive (IoU > 0.5)
2. False Positive
There are two possible scenarios where a BB would be considered as a false positive:
- IoU < 0.5
- Duplicated BB
3. False Negative
When our object detection model missed the target, then it would be considered as a false negative. The two possible scenarios are as follows:
- When there is no detection at all.

- When the predicted BB has an IoU > 0.5 but has the wrong classification, the predicted BB would be FN.

Precision/Recall Curve (PR Curve)
We can now calculate the precision and recall of our detection for a given class across the test set. Each BB would have its confidence level, usually given by its softmax layer, and would be used to rank the output. This is very similar to the information retrieval case, just that instead of having a similarity function d( , ) to provide the ranking, we used the model’s predicted BB’s confidence.
Interpolated Precision
Before we plot the PR curve, we first need to know the interpolated precision. The interpolated precision, p_interp, is calculated at each recall level, r, by taking the maximum precision measured for that r. The formula is given as such:
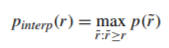
Where p(r)˜ is the measured precision at recall r˜.
Their intention of interpolating the PR curve was to reduce the impact of “wiggles” caused by small variations in the ranking of detections.
With that out of the way, we can now start plotting the PR curve. Consider an example for the person class with 3 TP and 4 FP. We calculate the corresponding precision, recall, and interpolated precision given by the formulas defined above.
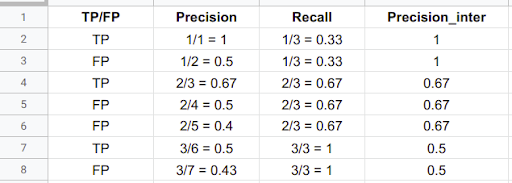
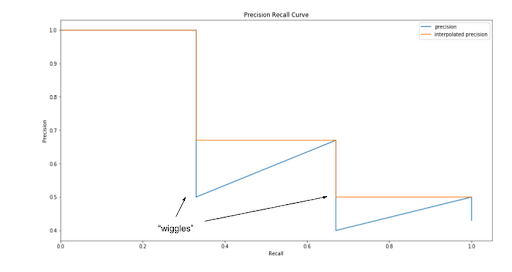
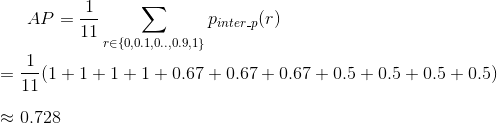
The AP is then calculated by taking the area under the PR curve. This is done by segmenting the recalls evenly to 11 parts: {0,0.1,0.2,…,0.9,1}. We get the following:
Calculating Mean Average Precision for Object Detection
The mAP for object detection is the average of the AP calculated for all the classes. It is also important to note that for some papers, they use AP and mAP interchangeably.
Other Ways of Calculating Average Precision
COCO provided six new methods of calculating AP.
Three of these methods are thresholding the BB at different IoUs:
- AP: AP at IoU= 0.50: 0.05: 0.95. This is the primary challenge metric)
- AP@IoU=0.5: Traditional way of calculating as described above.
- AP@IoU=0.75: IoU of BBs need to be > 0.75.
For the primary AP, 0.5:0.05:0.95 means starting from IoU = 0.5, with steps of 0.05, we increase to an IoU = 0.95. These would result in computations of AP threshold at ten different IoUs. An average is done to provide a single number which rewards detectors that are better at localisation.
The remaining three methods are calculating AP across scales:
- AP^small: AP for small objects: area < 32² px
- AP^medium: AP for medium objects: 32² < area < 96² px
- AP^large: AP for large objects: area > 96² px
This would allow better differentiation of models as some data sets have more small objects than others.
Frequently Asked Questions
What is mean average precision?
Mean average precision is a metric used to calculate the accuracy of performance for document/information retrieval and object detection models. It is the mean score of the average precision scores for model queries.
How do you calculate the mean average precision?
The mean average precision formula tells us that, for a given query, q, we calculate its corresponding average precision (AP), and then the mean of all these AP scores would give us a single number, called the mAP.
How does mean average precision impact data science/machine learning?
In data science and machine learning, precision of a given class in classification, or positive predictive value, is given as the ratio of true positive (TP) and the total number of predicted positives.