

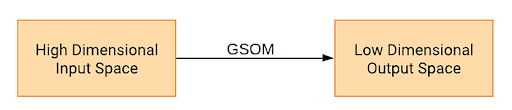
Self organizing map (SOM) is a data visualization technique that reduces the dimensions of data to a map to make it easier to understand high-dimensional data. The technique was proposed by Teuvo Kohonen. It showcases clustering by grouping similar data together. This clustering ability was well received after a variant of SOM, growing self-organizing map, was introduced.
What Is Self Organizing Maps?
Self organizing maps is a data visualization technique that clusters similar data together to make it easier to understand high-dimensional data. The technique differs from other error-correction methods because it follows competitive learning.
We can summarize SOM as:
SOM is unique as it deviates from the most generic error-correction approach and follows competitive learning.
How Does Self Organizing Maps Work?
Data points will be competing to get a representation in the network. First, the network is initialized with weights. Data from the training data set is randomly chosen, and the distance between nodes (weights) and sample vector is calculated. The shortest of the distances is considered the best matching unit (BMU). Then, the neighborhood of the winner node or BMU is found. The neighbor weights or nodes get updated. This process is repeated until the network is trained for every training data.
What Is a Best Matching Unit (BMU)?
A BMU is the winner node (or weight) that has the shortest distance from itself to the sample vector. There are numerous ways to determine the distance, however, the most common one is Euclidean distance.
Self Organizing Maps Steps
- Initiation: Randomization.
- Competition: Select winner node.
- Cooperation: Identify the neighborhood radius.
- Adaptation: Adapt weights of winners and neighbors.
- Smoothing: Reduce neighborhood radius as iterations increase, and introduce an optional smoothing phase.
Self Organizing Map Algorithm Parameters
- R/C: Number of rows/columns
- N: Number of neurons
- MaxIter: Number of iterations
- MaxNR: Maximum neighborhood radius of grid
- nr(t): Neighborhood radius
- ර(t): Learning rate
- A: number of dimensions
- D(wi,wj): Distance between Neuron i and j
- All_inputs={x1,x2….}: Input
- wk: All weights or nodes


Self Organizing Maps Example
Let initial weights be, w1 = (0.45,0.89), w2 = (0.55,0.83), w3 = (0.95,0.32) and w4 = (0.62,0.78). And let the four neurons (N=4) N1, N2, N3 and N4 be located at the grid in Cartesian plane positions (0,0), (1,0) , (1,0) and (1,1) respectively. And suppose the network takes a two-dimensional (A=2) input vector (x1,x2). Let w_i= (w1_i,w2_i) be the weight for the neuron i. nr = 0.6. Input vector (3,1). Assume learning rate = 0.5, and it is constant throughout. Assume initial weights as noted in the diagram.

1. Calculate Neighborhood Radius
Since this is the first iteration, nr = 0.6.
2. Calculate the Learning Rate
ර(t) = 0.5 and constant.
3. Calcualte the Winner Node
Find the nearest neighbor or the winner node for the given vector input (use Euclidean distance).
d (V,N1) = (3–0.45)² + (1–0.89)² = 6.514d (V,N2) = (3–0.55)² + (1–0.83)² = 6.03d (V,N3) = (3–0.62)² + (1–0.78)² = 5.71d (V,N4) = (3–0.95)² + (1–0.32)² = 4.66
Since d(V,N4) is the smallest distance, the winner node is N4.
5. Calculate Distance Between the Winner Node and Other Nodes
d(N4,N1) = sqrt ( (0.45–0.95)² + (0.89–0.3)²) = 0.75 (> nr)d(N4,N2) = sqrt ( (0.55–0.95)² + (0.89–0.32)²) = 0.648 (> nr)d(N4,N3) = sqrt ( (0.62–0.95)² + (0.89–0.78)²) = 0.566 (< nr)d(N4,N4) = sqrt ( (0.95–0.95)² + (0.89–0.89)²) = 0 (
6. Choose Nodes to Update Weights
Since d(N4,N3), d(N4,N4) < nr => N3,N4 chosen for updating their weights
7. Update the Weights
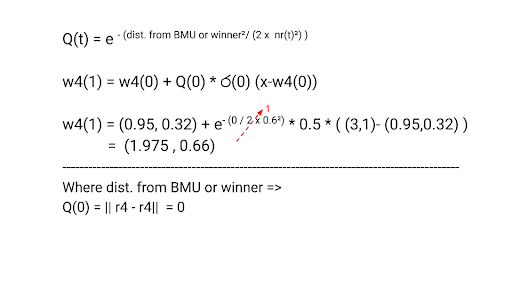
Next, update their weights using: w(t+1) = w(t) + Q(t) * ර(t) (x-w(t))
Updating the weight for N3:

Updating the weight for N4:
Understanding Self Organizing Maps
In this blog, we have discussed a small example of how the weights are added for a single input. Manual calculation for every input and for each epoch is complex and hence, we didn’t touch on that for this article. However, I’m hopeful that anything can be explained through an apt example and this article.
Frequently Asked Questions
What is a self organizing map?
A self organizing map is a data visualization algorithm that makes it easier to understand high dimensional data sets. The algorithm utilizes competitive learning to group clusters of data together.
How do self organizing maps work?
Self organizing maps is a data visualization algorithm that follows five steps:
- Initiation: Randomly selects a data point from the training set.
- Competition: Selects the node with the shortest distance to the sample vector.
- Cooperation: Identify the neighborhood radius.
- Adaptation: Adapt weights of winners and neighbors.
- Smoothing: Reduce neighborhood radius as iterations increase, and introduce an optional smoothing phase.


