
?")
Maximum likelihood estimation (MLE) is a method we use to estimate the parameters of a model so those chosen parameters maximize the likelihood that the assumed model produces the data we can observe in the real world.
What Is Maximum Likelihood Estimation Used For?
We can use MLE to estimate the parameters of regression models such as linear, logistic and Poisson regressions. We use these models in economics, finance and public health to analyze relationships between variables. We can also use MLE to estimate the parameters of more complex models, such as neural networks and decision trees.
A model is a mathematical representation of a process that produces our observed data. For example, we may use a linear model, which we can write as y=mx + c, to predict regional house prices. In this example, let’s say y equals the house prices we observe and x is equal to the number of rooms as an independent variable. This linear model describes the house prices in terms of the number of bedrooms. Parameters m and cact like the model’s blueprints. As you can see below, the characteristics of the model shift with the model’s changing parameters.
With the help of MLE, we choose parameter values so that the model describes a process that’s most likely to produce the observed data.
Best Practices of MLE in 3 Steps
- Assume a model for the observed data. The results will be heavily dependent on the model assumption so this is the most important step.
- Calculate the joint likelihood function containing the likelihood functions of each data point in terms of the model parameters.
- Find the parameter values that maximize the joint likelihood function. To do this, we need to find the derivative of the likelihood function and set it to zero.
Properties of Maximum Likelihood Estimation
Consistency
MLE is a consistent estimator, which means that as the sample size increases, the estimates obtained by the MLE approach the true values of the parameters if some conditions are met. In other words, as the sample size increases, the probability of getting the correct estimate of the parameters increases.
Asymptotic Normality
MLE follows the asymptotic normality property, which means that as the sample size increases, it converges in distribution to a normal distribution. MLE distribution here is the distribution of the parameter estimated with the different sets of observed data. This property is useful in hypothesis testing and constructing confidence intervals.
Invariance
The invariance property of MLE states that if we apply a function or transformation to the parameter we’re estimating, the MLE of the transformed parameter is equal to the transformation of the MLE of the original parameter. In other words, if we have an MLE for a parameter θ and we transform θ using a function g(θ), then the MLE of g(θ) is simply g(θ̂), where θ̂ is the MLE of θ.
Maximum Likelihood Estimation Examples
Let’s continue with the house prices example above.

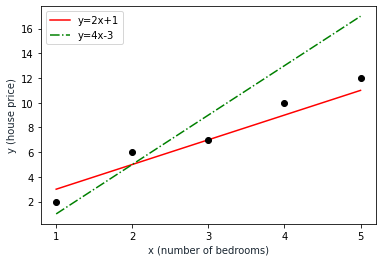
We have given sets of observed data that are shown as black dots in the above graph. They are(1, 2), (2, 6), (3,7), (4, 10) and (5,12). The numbers represent the bedroom number and the house price respectively.
We assume a linear model so we have two alternative solutions represented with two sets of parameters:
(m:2, c:1)(m:4, c:-3)
The red line represents the first alternative, which is modeled as y=2x+1 while the green line represents the second alternative as y=4x-3.
We’ll use the MLE method to find which set of parameters provides a model that better fits the observed data.
Below you’ll find the observed data points in the xand ycolumns.
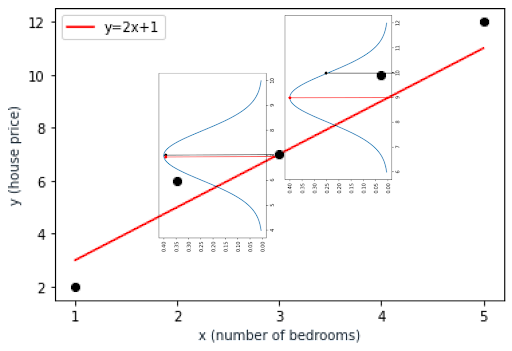
y_est is the value our first model estimates. It’s the value we get when we plug the x values into the y=2x+1 linear equation.

y = 2x + 1 function. | Image by Erdem IsbilenTo calculate the likelihood of a specific data point, we need to know the probability distribution of our data at each location. This means that we need to know (or assume) the distribution of house prices for each number of bedrooms. You can use any distribution function but for the sake of simplicity, I’ll use the normal distribution with a standard deviation of one.
Let’s see below how to calculate the likelihood value . Here’s the formula of the normal distribution that we consider for our data.
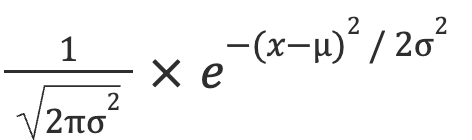
In this formula:
![]() is equal to
is equal to 1
![]() is equal to
is equal to (y -yest)2 as shown in the table above
When we plug the values into the probability distribution formula above, we can find the likelihood values of the data point.
So the likelihood value is 0.39 as seen in the distribution curve, which is the maximum possible value.
Let’s look at another data point. For the observed data point of (4, 10), the estimated value by our model is 9 whereas the observed value is 10. This time, the likelihood value of the data point is 0.25 as you can see in the distribution curve below.
You can see the same table for the other alternative model below. Likelihood values are small compared to the first model. This time, we have different y_est values in the table because they’re calculated by the y = 4x - 3 linear equation.

y = 4x - 3 function. | Image by Erdem IsbilenAs a result, likelihood values deteriorate as y_estvalues move away from the center of the distribution curve. For the data point (4,10), the likelihood value is almost zero because our model estimates the house price as 13 while the observed value is 10. The estimated value of 13 is far away from the distribution limits we assumed for the data point as you can see in the below graph.
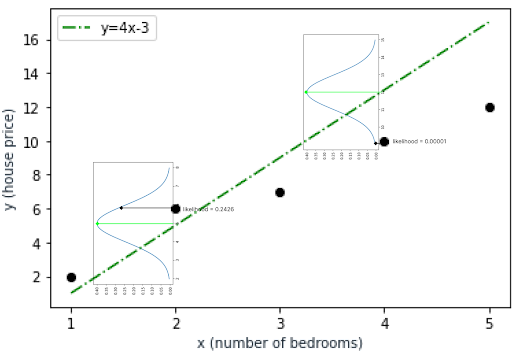
That means the first model better fits the observed data.
Maximum Likelihood Estimation Advantages and Disadvantages
Advantages of MLE
- MLE is known to be an efficient estimator, which means it produces estimates that have lower variances compared to other methods under certain assumptions.
- Asymptotically, MLE estimates become consistent as the sample size grows, which means that they converge to the true parameter values with probability
1. - Under certain conditions MLE can produce unbiased estimates of the population parameters.
- We can apply MLE to a wide range of statistical models. It’s widely used in fields such as economics, finance, biology and engineering.
Disadvantages of MLE
- MLE is sensitive to outliers, which can significantly affect our estimates of the parameters.
- MLE requires knowledge of the probability distribution that generates the data. If the distribution is misspecified, the estimates can be biased or inconsistent.
- In some cases, the likelihood function may be difficult to maximize, which can make the estimation process computationally expensive.
- MLE requires large sample sizes for accurate estimation but in some cases, you may not be able to collect large samples.


