

Recently, a friend asked me to explain confidence intervals in layperson’s terms. It turns out ... that’s hard to do.
Here’s what I found on Wikipedia:
“In statistics, a confidence interval (CI) is a type of estimate computed from the statistics of the observed data. This proposes a range of plausible values for an unknown parameter. The interval has an associated confidence level that the true parameter is in the proposed range. This is more clearly stated as: The confidence level represents the probability that the unknown parameter lies in the stated interval. The level of confidence can be chosen by the investigator. In general terms, a confidence interval for an unknown parameter is based on sampling the distribution of a corresponding estimator.”
... What? It’s like someone purposefully wrote this so nobody (not even trained data scientists) could understand it. We see this a lot with statisticians: They love employing specialist terminology and end up obscuring their meaning. So let’s dive into understanding confidence intervals without all the jargon.
What Is a Confidence Interval?
Confidence Interval Example
Imagine you want to find the mean (average) height of all the people in a particular U.S. state.
You could go to each person in that particular state and ask for their height, or you can do the smarter thing by taking a sample of 1,000 people in the state. Then you can use the mean height for those 1,000 people (estimated mean) to estimate the average height in the state (true mean).
This is all well and good, but being the true data scientist you are, you’re not satisfied. The estimated mean is just a single number and you want to have a range where the true mean could lie.
Why do we want a range? Because in real life, we’re concerned about the confidence of our estimates.
Typically, even if I ask you to guess the height of people in the particular U.S. state, you’re more inclined to say something like: “I believe it’s between six feet and six feet and two inches” rather than a point estimate like, “It’s six feet and 2.2345 inches.”
We humans also like to attach a level of confidence when we give estimates. Have you ever said “I’m 99 percent sure?” Probably. I’m 99 percent sure you have.
In this particular example, I can be more confident about the statement, “I believe it’s between five feet and seven feet” than “I believe it’s between six feet and six feet and two inches” as the first range is a superset of the second one. The wide net we’re casting is between five feet and seven feet.
So how do we get this range and quantify a confidence value?
How to Calculate Confidence Interval
To understand how we will calculate confidence intervals, we need to understand the central limit theorem.
Central limit theorem (CLT) simply states that if you have a population with mean μ and standard deviation σ, and take random samples from the population, then the distribution of the sample mean will be approximately normally distributed with mean as the population mean. The estimated standard deviation s/√n where s is the standard deviation of the sample and n is the number of observations in the sample.
So knowing all this, you become curious. We already have a sample of 1,000 people in this U.S. state. Can we apply CLT?
We know the mean of the sampling distribution is equal to the population mean (which we don’t know and want to estimate) and the sample deviation of the sampling distribution is σ/√n (i.e. the standard deviation of the sample divided by the number of observations in the sample).
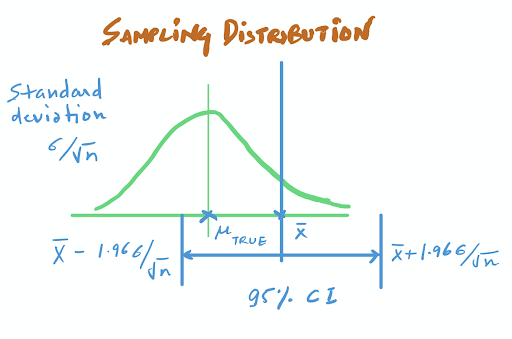
Now, you want to find intervals on the X-axis that contain the true population mean.
So what do we do? We cast a net from the value we know.
To get such ranges/intervals, we go 1.96 standard deviations away from Xbar, the sample mean in both directions. This range is the 95 percent confidence interval.
Now, when I say I estimate the true mean to be Xbar (the sample mean) with a confidence interval of [Xbar-1.96SD, Xbar+1.96SD], I’m saying: This is an interval constructed using a certain procedure. Were this procedure to be repeated on numerous samples, the fraction of calculated confidence intervals (which would differ for each sample) that encompass the true population parameter would tend toward 95 percent.
So, what does it really mean when you take the 99 percent CI—when you’re 99 percent sure? You essentially increase the proportion and thus cast a wider net with three standard deviations.

In this simple formula:
-
Xbar is the sample mean (mean of the 1,000 height samples you took).
-
Z is the number of standard deviations away from the sample mean (1.96 for 95 percent, 2.576 for 99 percent) — the level of confidence—you want.
-
s is the standard deviation in the sample.
-
n is the size of the sample.
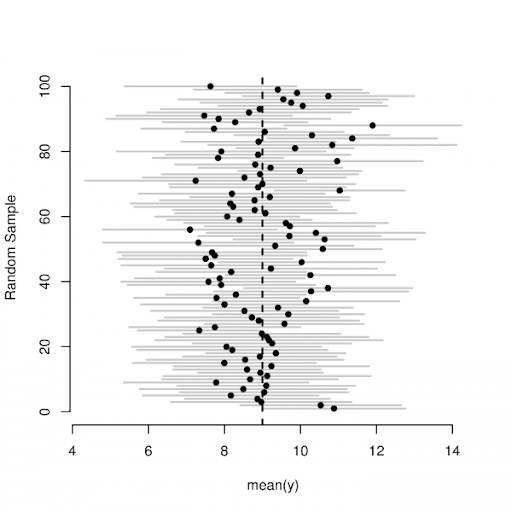
Each line in the figure above is one such experiment where the dot signifies the sample mean, and the horizontal line signifies the range. The dotted line in this figure is the true population mean.
See how some of these intervals don’t contain the true population mean, and almost all of them (95 percent) do include the true population mean? This means that, because of the way we’ve defined our procedure (starting from a random sample), 95 percent of the time our confidence interval will contain the true population mean. In other words, we can be 95 percent sure the true population mean falls within the interval.
Z Values for Confidence Interval
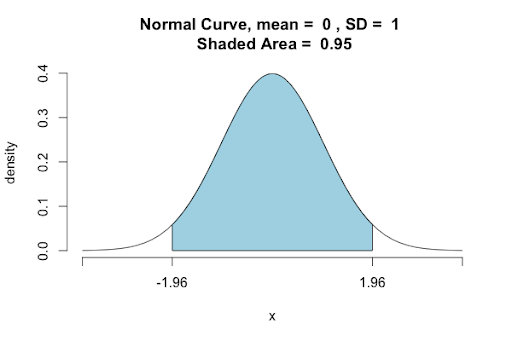
As we said, Z is the number of standard deviations away from the sample mean (1.96 for 95 percent, 2.576 for 99 percent) — the level of confidence — you want.
You can go for any arbitrary level of confidence. Say, for example, you want 90 percent confidence. You can get that by using the idea that the shaded area inside the normal curve needs to be 0.90.
import scipy.stats as st

p = 0.9 + (1-0.9)/2

Z = st.norm.ppf(p, loc=0, scale=1)

print(Z)

----------------------------------------------------------

1.6448536269514722


import scipy.stats as st

p = 0.9 + (1-0.9)/2

Z = st.norm.ppf(p, loc=0, scale=1)

print(Z)

----------------------------------------------------------

1.6448536269514722
Confidence intervals can be a difficult concept to grasp but they just make intuitive sense when explained in simpler terms. In essence, confidence intervals are as simple as casting a net around information in the form of the point estimate so we capture the true value inside our net. At least I’m 99 percent sure....
Frequently Asked Questions
What is a confidence interval?
A confidence interval is a range of estimates in a sample distribution where a true population value lies, with a certain level of confidence or probability. Confidence intervals are often used to determine the certainty of a true estimated value (such as a mean) for a population, based on sample data taken from that population.
For example, if a confidence interval related to the mean of sample data is 10 to 20, and the confidence level is 95 percent, one can be 95 percent certain that the true mean of the population will fall between 10 to 20.
How to calculate confidence interval?
Confidence interval (CI) can be calculated using the following formula:
CI = sample mean ± confidence level * sample standard deviation / √sample size
The result received using the "+" symbol is the upper limit of the confidence interval, while the result received using the "-" symbol is the lower limit of the confidence interval.


