I first came across Cohen’s kappa on Kaggle during the Data Science Bowl competition. While I didn’t compete, and the metric was the quadratic weighted kappa, I forked a kernel to play around with it and understand how it works. I then revisited the topic for the University of Liverpool — Ion Switching competition. Let’s break down Cohen’s kappa.
What Is Cohen’s Kappa?
Cohen’s kappa is a quantitative measure of reliability for two raters who are rating the same thing, accounting for the possibility that the raters may agree by chance and adjusting accordingly.
Validity and Reliability Defined
To better understand that definition, I’d like to lay out an important foundation about validity and reliability. When we talk of validity, we are concerned with the degree to which a test measures what it claims to measure. In other words, how accurate the test is. Reliability is concerned more with the degree to which a test produces similar results under consistent conditions. Or to put it another way, the consistency of a test.
What Is Validity vs. Reliability?
- Validity: This represents the degree to which a test measures what it claims to measure. In other words, the accuracy of a test.
- Reliability: This represents the degree to which a test is able to reproduce similar results. In other words, the consistency of a test.
I will put these two measurements into perspective so that we know how to distinguish them from one another.
The problem that the University of Liverpool had was that the existing methods of detecting when an ion channel is open were slow and laborious. Through the Ion Switching competition, it wanted data scientists to employ machine learning techniques to enable rapid automatic detection of an ion channel’s current events in raw data. Validity would measure if the scores obtained represented whether the ion channels were opened, and reliability would measure if the scores obtained were consistent in identifying whether a channel is opened or closed.
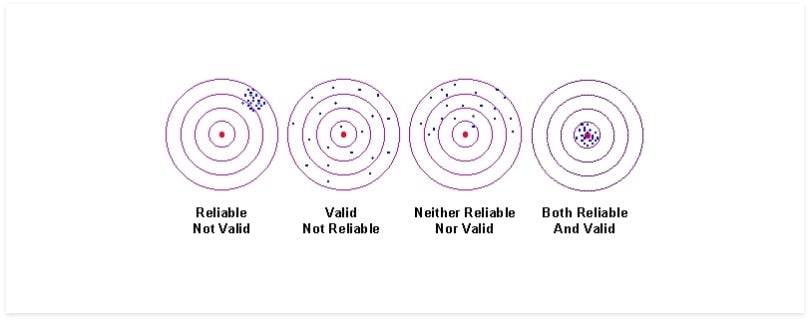
For the results of an experiment to be useful, the observers of the test would have to agree on its interpretation. Otherwise, subjective interpretation by the observer can come into play. Therefore, good reliability is important. However, reliability can be broken down into different types: Intra-rater reliability and inter-rater reliability.
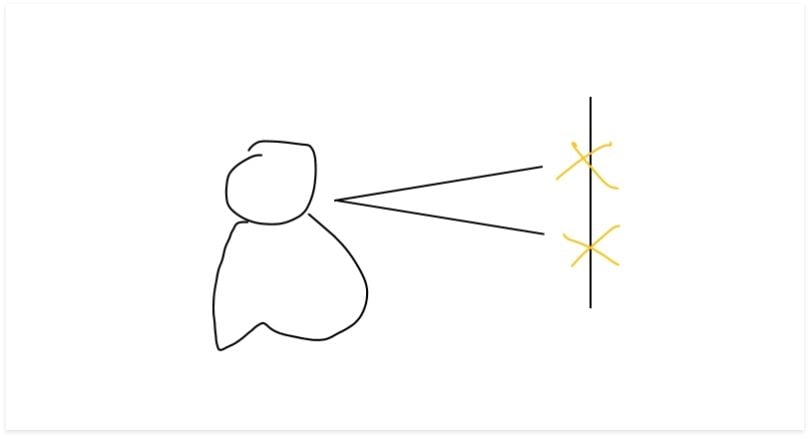
Intra-rater reliability is related to the degree of agreement between different measurements made by the same person.
Inter-rater reliability is related to the degree of agreement between two or more raters.
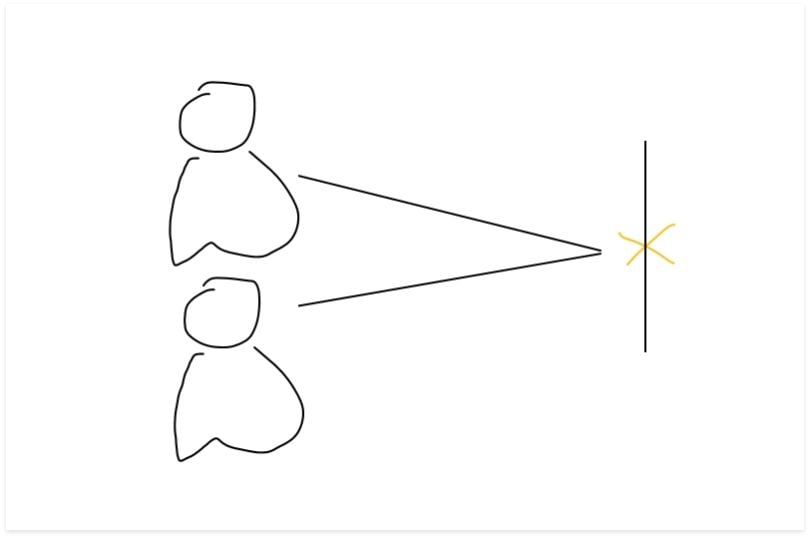
Recall that earlier we said that Cohen’s kappa is used to measure the reliability for two raters rating the same thing, while correcting for how often the raters may agree by chance.
How to Calculate Cohen’s Kappa
The value for kappa can be less than zero, or in other words, negative. A score of zero means that there is random agreement among raters, whereas a score of one means that there is a complete agreement between the raters. Therefore, a score that is less than zero means that there is less agreement than random chance — or disagreement. I will show you the formula to work this out, but it is important that you acquaint yourself with “Figure 4” to have a better understanding:
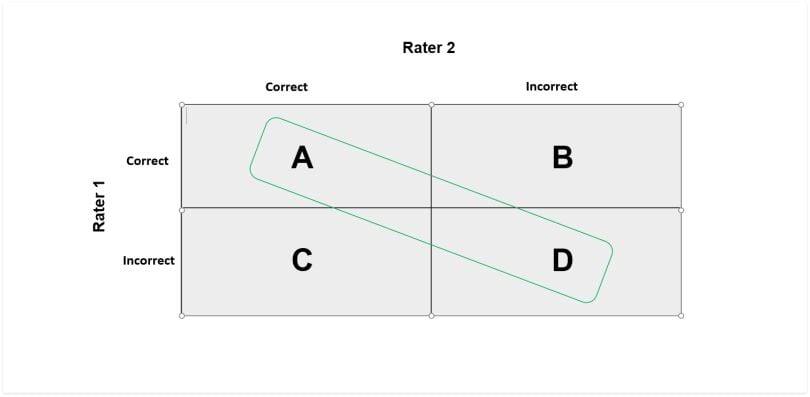
The reason I highlighted two grids will become clear in a moment, but for now, let me break down each grid.
- A: The total number of instances that both raters said were correct. The raters are in agreement.
- B: The total number of instances that Rater 2 said was incorrect, but Rater 1 said were correct. This is a disagreement.
- C: The total number of instances that Rater 1 said was incorrect, but Rater 2 said were correct. This is also a disagreement.
- D: The total number of instances that both raters said were incorrect. Raters are in agreement.
In order to work out the kappa value, we first need to know the probability of agreement, hence why I highlighted the agreement diagonal. This formula is derived by adding the number of tests in which the raters agree, and then dividing it by the total number of tests. Using the example from “Figure 4,” that would mean: (A + D)/(A + B+ C+ D).

The next step is to work out the probability of random agreement. Using “Figure 4” as a guide, the expected value is the total number of times that “Rater 1” said “correct” divided by the total number of instances, multiplied by the total number of times that “Rater 2” said “correct” divided by the total number of instances, added to the total number of times that “Rater 1” said “incorrect” multiplied by the total number of times that “Rater 2” said “incorrect.” To simplify things, I have formulated the equation using the previous grid:
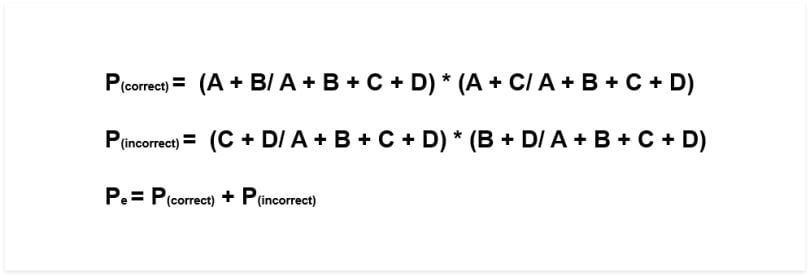
The formula for Cohen’s kappa is the probability of agreement minus the probability of random agreement, divided by one minus the probability of random agreement.

You’re now able to distinguish between reliability and validity, explain Cohen’s kappa and evaluate it. This statistic is very useful. Now that I understand how it works, I believe that it may be under-utilized when optimizing algorithms to a specific metric.
Frequently Asked Questions
What is Cohen’s kappa?
Cohen’s kappa is a statistical metric that measures the reliability of two raters rating the same thing, while taking into account the possibility that they could agree by chance. This allows Cohen’s kappa to determine the level of agreement between two raters.
How is Cohen’s kappa different from simple agreement?
Simple agreement merely measures how many times two raters agree and divides that by the total number of ratings to produce a percentage. Cohen’s kappa goes one step further by accounting for the possibility of two raters agreeing by chance. As a result, simple agreement could overestimate the agreement between two raters.
What is the Cohen’s effect size for kappa?
Cohen’s effect size for kappa is a guideline to interpret the strength of agreement between two raters beyond chance. According to Cohen, a kappa value of 0.01–0.20 indicates a “slight” agreement, 0.21–0.40 is “fair,” 0.41–0.60 is “moderate,” 0.61–0.80 is “substantial” and 0.81–1.00 is an “almost perfect” agreement.
What does a high kappa score mean?
A high kappa score means that there is strong agreement between raters, or classification systems —beyond what would be expected by chance. In practical terms, this indicates that the raters are consistently making similar decisions or judgments.
What are acceptable kappa values?
Determining whether a kappa value is acceptable depends on the context. In most research settings, 0.60 or higher is considered satisfactory, but more rigorous fields may require 0.70 or above.
What does a negative kappa value mean?
When using Cohen’s kappa, a negative value means that there’s less agreement than random chance. This suggests the two raters are in disagreement with each other.


