

In this article, we’ll prep a machine learning model to predict who survived the Titanic. To do that, we first have to clean up our data. I’ll show you how to apply preprocessing techniques on the Titanic data set.
How to Preprocess Data in Python Step-by-Step
- Load data in Pandas.
- Drop columns that aren’t useful.
- Drop rows with missing values.
- Create dummy variables.
- Take care of missing data.
- Convert the data frame to NumPy.
- Divide the data set into training data and test data.
To get started, you’ll need:
What Is Data Preprocessing and Why Do We Need It?
For machine learning algorithms to work, it’s necessary to convert raw data into a clean data set, which means we must convert the data set to numeric data. We do this by encoding all the categorical labels to column vectors with binary values. Missing values, or NaNs (not a number) in the data set is an annoying problem. You have to either drop the missing rows or fill them up with a mean or interpolated values.
Kaggle provides two data sets: training data and results data. Both data sets must have the same dimensions for the model to produce accurate results.
1. Load Data in Pandas
To work on the data, you can either load the CSV in Excel or in Pandas. For the purposes of this tutorial, we’ll load the CSV data in Pandas.
df = pd.read_csv('train.csv')Let’s take a look at the data format below:
>>> df.info()
<class 'pandas.core.frame.DataFrame'>
Int64Index: 891 entries, 0 to 890
Data columns (total 12 columns):
PassengerId 891 non-null int64
Survived 891 non-null int64
Pclass 891 non-null int64
Name 891 non-null object
Sex 891 non-null object
Age 714 non-null float64
SibSp 891 non-null int64
Parch 891 non-null int64
Ticket 891 non-null object
Fare 891 non-null float64
Cabin 204 non-null object
Embarked 889 non-null object
If you carefully observe the above summary of Pandas, there are 891 total rows but Age shows only 714 (which means we’re missing some data), Embarked is missing two rows and Cabin is missing a lot as well. Object data types are non-numeric so we have to find a way to encode them to numerical values.
2. Drop Columns That Aren’t Useful
Let’s try to drop some of the columns that won’t contribute much to our machine learning model. We’ll start with Name, Ticket and Cabin.
cols = ['Name', 'Ticket', 'Cabin']
df = df.drop(cols, axis=1)
We dropped three columns:
>>>df.info()
PassengerId 891 non-null int64
Survived 891 non-null int64
Pclass 891 non-null int64
Sex 891 non-null object
Age 714 non-null float64
SibSp 891 non-null int64
Parch 891 non-null int64
Fare 891 non-null float64
Embarked 889 non-null object
3. Drop Rows With Missing Values
Next we can drop all rows in the data that have missing values (NaNs). Here’s how:
>>> df = df.dropna()

>>> df.info()
Int64Index: 712 entries, 0 to 890
Data columns (total 9 columns):
PassengerId 712 non-null int64
Survived 712 non-null int64
Pclass 712 non-null int64
Sex 712 non-null object
Age 712 non-null float64
SibSp 712 non-null int64
Parch 712 non-null int64
Fare 712 non-null float64
Embarked 712 non-null object
The Problem With Dropping Rows
After dropping rows with missing values, we find the data set is reduced to 712 rows from 891, which means we are wasting data. Machine learning models need data to train and perform well. So, let’s preserve the data and make use of it as much as we can. More on this below.
4. Creating Dummy Variables
Instead of wasting our data, let’s convert the Pclass, Sex and Embarked to columns in Pandas and drop them after conversion.
dummies = []
cols = ['Pclass', 'Sex', 'Embarked']
for col in cols:
   dummies.append(pd.get_dummies(df[col]))
Then…
titanic_dummies = pd.concat(dummies, axis=1)Now we’ve transformed eight columns wherein 1, 2 and 3 represent the passenger class.
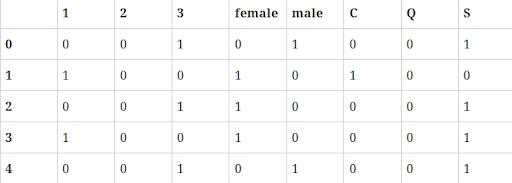
Finally we concatenate to the original data frame, column-wise:
df = pd.concat((df,titanic_dummies), axis=1)Now that we converted Pclass, Sexand Embarked values into columns, we drop the redundant columns from the data frame.
df = df.drop(['Pclass', 'Sex', 'Embarked'], axis=1)Let’s take a look at the new data frame:
>>>df.info()
PassengerId 891 non-null int64
Survived 891 non-null int64
Age 714 non-null float64
SibSp 891 non-null int64
Parch 891 non-null int64
Fare 891 non-null float64
1 891 non-null float64
2 891 non-null float64
3 891 non-null float64
female 891 non-null float64
male 891 non-null float64
C 891 non-null float64
Q 891 non-null float64
S 891 non-null float64
5. Take Care of Missing Data
Everything’s clean now, except Age, which has lots of missing values. Let’s compute a median or interpolate() all the ages and fill those missing age values. Pandas has an interpolate() function that will replace all the missing NaNs to interpolated values.
df['Age'] = df['Age'].interpolate()Now let’s observe the data columns. Notice Age is now interpolated with imputed new values.
>>>df.info()
Data columns (total 14 columns):
PassengerId 891 non-null int64
Survived 891 non-null int64
Age 891 non-null float64
SibSp 891 non-null int64
Parch 891 non-null int64
Fare 891 non-null float64
1 891 non-null float64
2 891 non-null float64
3 891 non-null float64
female 891 non-null float64
male 891 non-null float64
C 891 non-null float64
Q 891 non-null float64
6. Convert the Data Frame to NumPy
Now that we’ve converted all the data to integers, it’s time to prepare the data for machine learning models. This is where scikit-learn and NumPy come into play:
X= Input set with 14 attributes
y = Small y output, in this case Survived
Now we convert our data frame from Pandas to NumPy and we assign input and output:
X = df.values
y = df['Survived'].values
X still has Survived values in it, which should not be there. So we drop in the NumPy column, which is the first column.
X = np.delete(X, 1, axis=1)
7. Divide the Data Set Into Training Data and Test Data
Now that we’re ready with X and y, let's split the data set: we’ll allocate 70 percent for training and 30 percent for tests using scikit model_selection.
from sklearn.model_selection import train_test_split
X_train, X_test, y_train, y_test = train_test_split(X, y, test_size=0.3, random_state=0)
Now you can preprocess data on your own. Go on and try it for yourself to start building your own models and making predictions.
Frequently Asked Questions
What does it mean to preprocess data in Python?
Preprocessing data refers to transforming raw data into a clean data set by filling in missing values, removing repetitive features and making sure all data fits a uniform scale, among other techniques. This way, machine learning algorithms can understand the data and improve their performance as a result.
How do you preprocess data in Python code?
To preprocess data in Python, follow these guidelines:
- Load data
- Remove unnecessary data
- Remove rows with missing data
- Create dummy variables
- Fill in any remaining missing data
- Convert the data
- Split the data set into training and test data


