The seeds of knowledge graphs were sown long ago, with the advent of modern computing in the 1950s. However, researchers only defined the concept at the turn of the millennium. And Google didn’t popularize the term until 2012. Soon, Facebook, Microsoft, Amazon and other tech giants jumped on the bandwagon.
The term quickly turned into a buzzword that has stuck around in tech spaces. You’ll hear it thrown around regularly at conferences, team huddles, and wherever tech experts gather for brainstorming sessions.
But if you aren’t familiar with the term “knowledge graph” and its different uses, this comprehensive guide covers all you need to know. You’ll soon learn how to deploy it in future team meetings.
Let’s dive in!
What Is a Knowledge Graph?
The knowledge graph is a data cluster that helps users grasp and model complex concepts. It’s helpful for studying and analyzing complex relationships between various data points. This tool can help you make better business decisions based on factual data.
How Do Knowledge Graphs Work?
Knowledge graphs pull information from various datasets and use schemas and identities to provide context and structure to the information. Knowledge graphs also use machine learning and natural language processing to identify the relationships between data and objects.
Despite the graph’s intricacy, it often gives better explanations than basic pies and charts. Unlike pyramids and ladder illustrations, knowledge graphs need little to no interpretation as the words are directly connected to the boxes provided in the graph.
Its structure involves nodes and edges. A node is a point in the knowledge graph that depicts an entity or its types, such as an individual, organization, object, or place. An edge is a connection or the relationship between two nodes in the graph.
You may have also heard the term “ontology” used in the context of knowledge graphs. An ontology serves to formally represent the nodes in a graph. It is a model or subset that lists the types of entities, their interconnected relationships, and the limitations in combining entities and their relationships. It essentially lays down the rules that govern the relationships among various entities.
Note that a knowledge graph is different from a regular database. Although the latter is occasionally populated, it largely remains dormant. The former is dynamic and ever-changing. It keeps re-purposing itself to provide new insights and inferences to its users.
Since a knowledge graph is depicted graphically, users can easily extend and revise the ontology when new data arrives. Moreover, a knowledge graph understands what connects entities on its own. This eliminates the need to manually program new data every single time.
Examples of Knowledge Graphs
Nowadays, many tech companies and other service businesses use knowledge graphs. You’ll find many popular knowledge graphs that define user expectations for search systems in various organizations.
Some of the most well-known consumer-facing knowledge graphs include the following.
Google Knowledge Graph
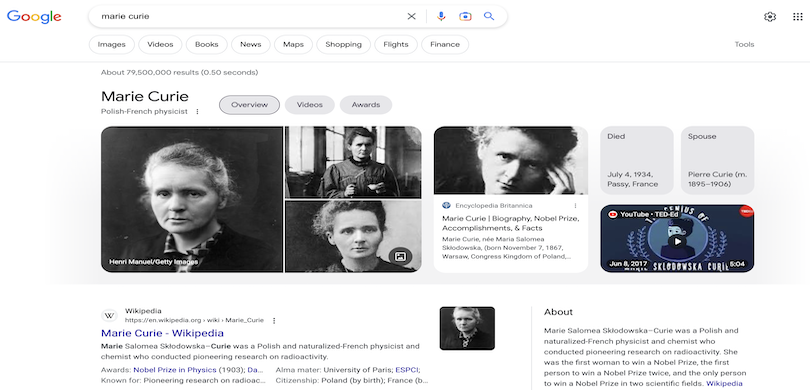
This knowledge graph takes the form of Google Search Engine Results Pages (SERPs) that provide information based on the searches of people from all over the world. It comprises more than 500 million people, places, businesses and things.
It generates its data from various sources, such as Wikipedia, Freebase, the CIA World Factbook and more. Students and researchers may find this feature useful when they need to conduct extensive research.
Wikidata Knowledge Graph
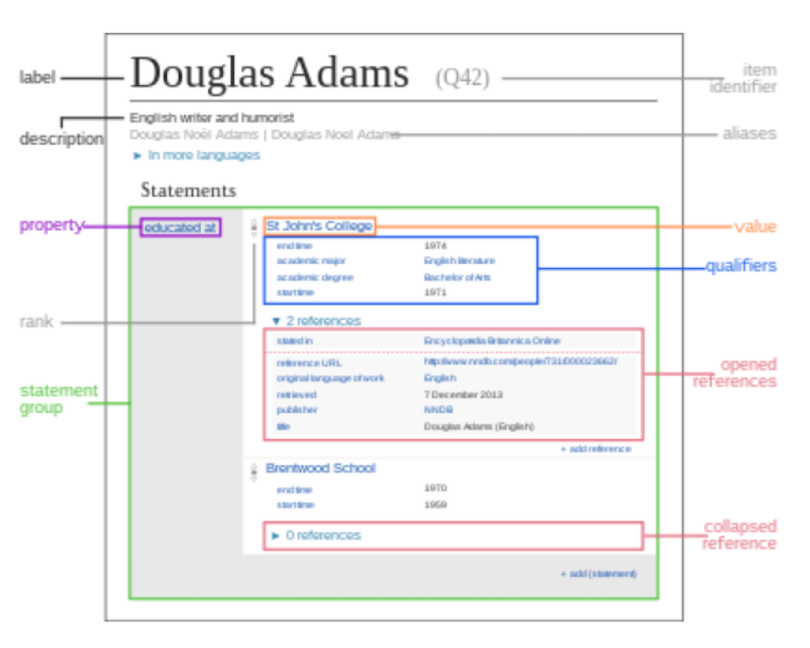
Wikidata is a free and open multilingual knowledge graph from the Wikimedia Foundation. Wikipedia users and other entities can use this collaboratively edited knowledge graph under the CC0 public domain license. Other uses for Wikidata include performing background checks on certain individuals.
DBPedia Knowledge Graph
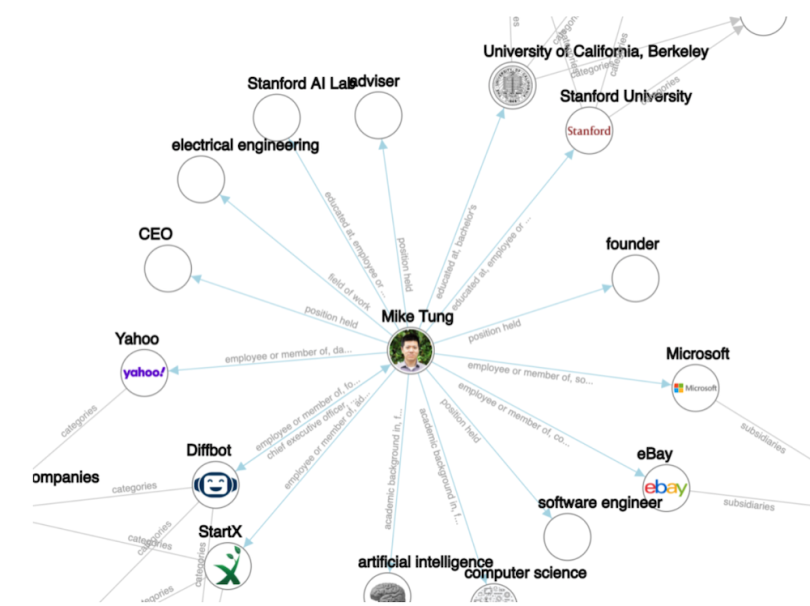
Like Wikidata, DBPedia is a knowledge graph using Wikipedia data. Although Wikidata covers secondary and tertiary objects, DBPedia focuses on data from Wikipedia’s infoboxes.
DBPedia’s dataset includes 38 million labels and abstracts in 125 languages. Its ontology comprehensively covers various entities, such as people, places, organizations, books, films, species, diseases and more. DBPedia is the core of the Open Linked Data movement and has helped enterprises create their own knowledge graphs with millions of crowdsourced entities.
Both employers and job seekers can use DBPedia if they find relevant experience and workplaces useful in pursuing their careers.
GeoNames Knowledge Graph
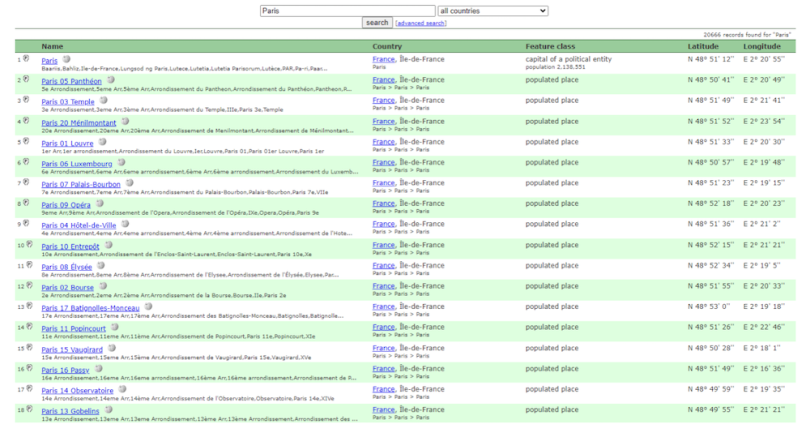
GeoNames is an open and free knowledge graph for global geographical entities. It gives its users easy access to more than 11 million place names under a creative commons attribution license. GeoNames records coordinates and population density that campers or travelers can use when they need directions.
WordNet Knowledge Graph
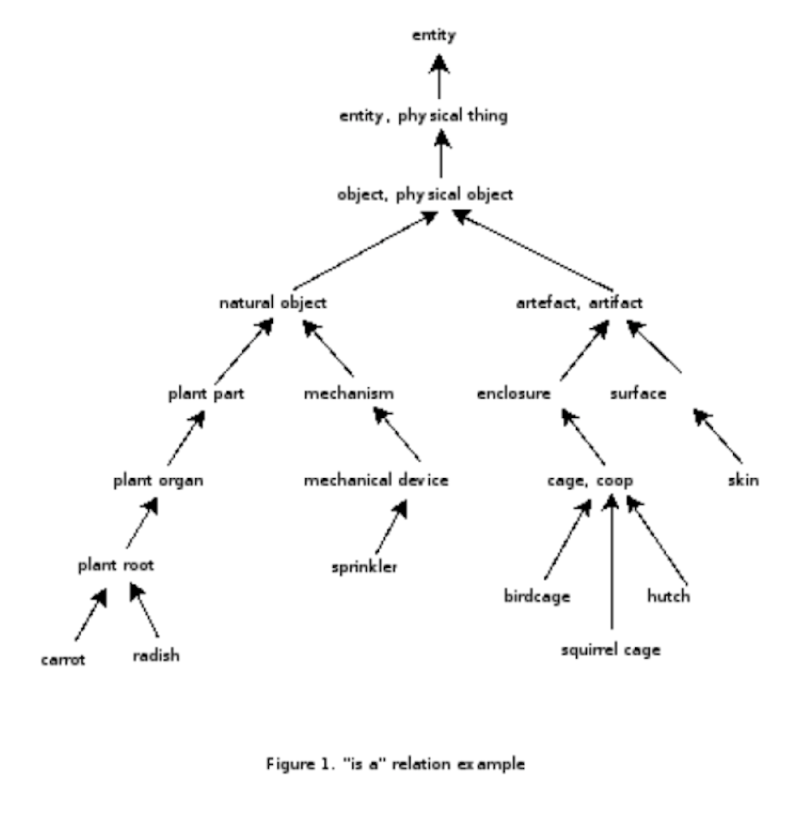
WordNet is one of the most popular and comprehensive lexical knowledge graphs for words in more than 200 languages. It provides definitions and synonyms to help users study the semantic relationships between words. WordNet is often used to improve the performance of NLP and search applications.
Those interested in learning deeper and more comprehensive definitions of the English language can use WordNet for their personal endeavors.
What Are the Uses of Knowledge Graphs?
Knowledge graphs have wide-ranging uses in many industries, such as the following.
Retail
Knowledge graphs are excellent tools for the retail industry. They help marketers understand customer behavior, how they relate with other customers, and the kind of products people may purchase together. This helps brands craft more powerful and targeted marketing campaigns and develop upselling and cross-selling strategies.
Knowledge graphs are also great for product design and development. Companies can use knowledge of the relationships between various products to launch new items that will perform well in the market and entice their audience.
Knowledge graphs can also help businesses identify common customer issues and resolve them quickly to provide top-notch service.
Finance
The finance industry has used knowledge graphs for years to spearhead important projects like know-your-customer (KYC) and anti-money laundering initiatives.
Knowledge graphs aid in preventing and investigating financial crimes. They allow banks and other financial institutions to keep track of the flow of money across their customer base and spot non-compliant customers.
Healthcare
Knowledge graphs are essential in the field of healthcare as they organize and categorize complex relationships of data sets within medical research. They provide vital information that helps healthcare providers validate diagnoses and identify treatment plans that cater to individual needs.
Entertainment
Content platforms such as Netflix, Amazon, Facebook and others use knowledge graphs to create artificial intelligence (AI) based recommendation engines. They use data from clicks, likes and other online engagement behaviors to recommend new content for users to engage with.
Knowledge Graphs and Decision-Making
Knowledge graphs are an interactive, flexible way to organize complex data sets that involve different entities and relationships among them.
Their dynamic nature helps users make better decisions using data from the ground rather than static data that has not been updated for years. Users from a wide range of fields and industries have the resources they need to improve their knowledge management systems and stay ahead of their competitors.


