in Python")
Support vector machine (SVM) is a supervised machine learning algorithm and linear model used for classification and regression tasks. A support vector machine algorithm creates a line or a hyperplane — known as a decision boundary — that separates data into different classes. It can solve linear and simple non-linear problems, and works well for many practical machine learning tasks such as text classification, image classification and anomaly detection.
Support Vector Machine (SVM) Explained
A support vector machine (SVM) is a supervised machine learning algorithm used for classification and regression tasks. It works by creating a line or hyperplane to separate data into classes.
I’ll offer an overview of SVMs. I will talk about the theory behind SVMs, its application for non-linearly separable data sets and how to implement SVMs in Python.
What Is a Support Vector Machine?
Support vector machines (SVMs) are supervised algorithms that find a separating line (or hyperplane) between data of two classes. It works by taking the data as an input and outputting a line that separates those data classes if possible.
Suppose you have a data set, as shown below, and you need to classify the red rectangles from the blue ellipses, let’s say the positives from the negatives. Your task is to find an ideal line that separates this data set in two classes, red and blue.
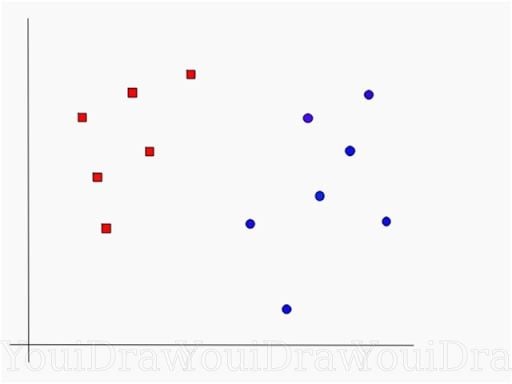
Not too challenging, right?
But there isn’t a unique line that does the job. In fact, we have infinite lines that can separate these two classes. So, how does SVM find the ideal one?
Let’s examine some probable candidates and figure it out ourselves.
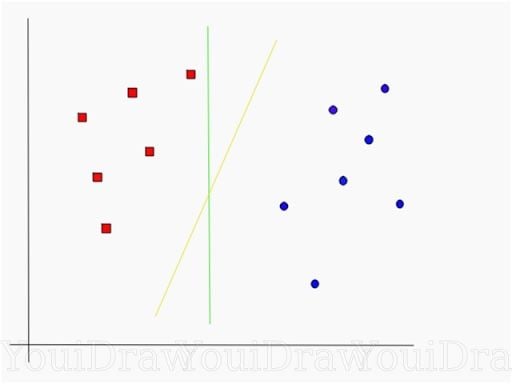
We have two candidates here, the green colored line and the yellow colored line. Which line according to you best separates the data?
If you selected the yellow line then congrats, because that’s the line we are looking for. It’s visually quite intuitive in this case that the yellow line classifies better. But, we need something concrete to fix our line.
The green line in the image above is quite close to the red class. Though it classifies the data set it’s not a generalized line, and in machine learning, our goal is to get a generalized separator.
What Is a Hyperplane in a Support Vector Machine?
A hyperplane in an n-dimensional Euclidean space is a flat, n-1 dimensional subset of that space that divides the space into two disconnected parts.
For example, let’s assume a line to be our one dimensional Euclidean space, our data sets lie on a line. Now, pick a point on the line, this point divides the line into two parts. The line has one dimension, while the point has zero dimensions. So, a point is a hyperplane of the line.
For two dimensions, we saw that the separating line was the hyperplane. Similarly, for three dimensions a plane with two dimensions divides the 3D space into two parts and acts as a hyperplane. For a space of n dimensions, we have a hyperplane of n-1 dimensions separating it into two parts.
How Support Vector Machines Find the Optimal Hyperplane
According to the SVM algorithm, we find the points closest to the line from both the classes. These points are called support vectors. Now, we compute the distance between the line and the support vectors. This distance is called the margin. Our goal is to maximize the margin. The hyperplane, for which the margin is maximum, is the optimal hyperplane.
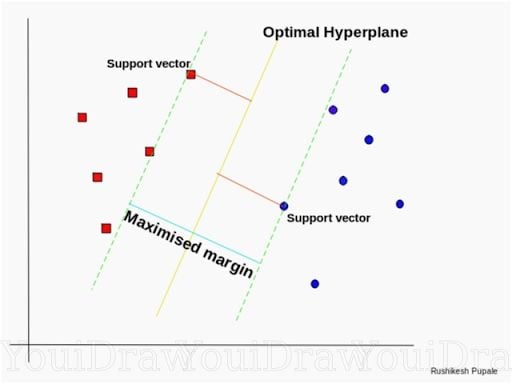
SVM tries to make a decision boundary so that the separation between the two classes, that street, is as wide as possible.
Seems simple, right? Let’s consider a more complex data set that isn’t linearly separable.
How Support Vector Machines Calculate a Hyperplane in Higher Dimensions

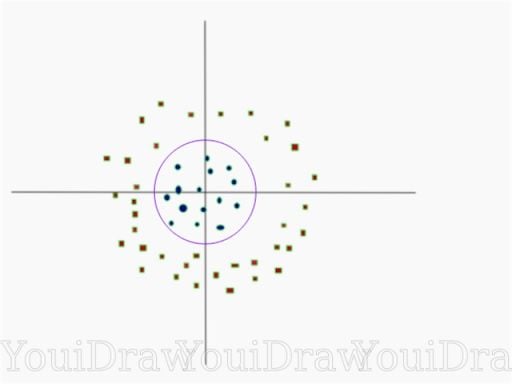
This data is clearly not linearly separable. We can’t draw a straight line that can classify this data. But the data can be converted to linearly separable data in a higher dimension. Let’s add one more dimension and call it a z-axis. The coordinates on the z-axis will be governed by the constraint: z = x²+y².
Basically, the z coordinate is the square of distance of the point from origin. Let’s plot the data on z-axis.

Now, the data is linearly separable. Let the purple line separating the data in higher dimension be z=k, where k is a constant. Since, z=x²+y², we get x² + y² = k, which is an equation of a circle. So, we can project this linear separator from a higher dimension back to its original dimensions using this transformation.
We can classify data by adding an extra dimension to it so that it becomes linearly separable and then projecting the decision boundary back to original dimensions using mathematical transformation. But finding the correct transformation for any given data set isn’t that easy. Thankfully, we can use Kernels in Sklearn’s SVM implementation to do this job.
Applications of Support Vector Machines
Support vector machines can be useful for various machine learning tasks in classification and regression. Here are some of the most common applications support vector machines are used for:
Text Classification
SVMs are often applied for text recognition and natural language processing (NLP) tasks, such as handwriting recognition, sentiment analysis, topic modeling and spam detection in emails or messaging. SVMs are effective at dealing with high-dimensional data, making them useful for tackling these kinds of tasks.
Image Classification
SVMs can be applied for image classification tasks, such as object detection, facial recognition and image retrieval. The use of kernels in SVMs help transform data inputs into a high-dimensional space, allowing for easier linear separation of complex data — like pixels in an image — into distinct classes.
Outlier and Anomaly Detection
SVMs, specifically one-class support vector machines, can be applied to detect outliers or anomalies in data. This makes SVMs useful for tasks in bioinformatics (like disease detection, genetic analysis and cancer research), and for tasks like fraud detection and malware detection.
Advantages and Disadvantages of Support Vector Machines
Like many machine learning algorithms, support vector machines come with their own advantages and disadvantages. Here are the main ones to know.
Advantages of Support Vector Machines
1. Effective for High-Dimensional Data
SVMs excel in working with small data sets that have a high amount of features (dimensions). This makes them effective for solving complex classification and regression problems.
2. Can Handle Linear and Simple Non-Linear Data
SVMs are able to establish a decision boundary for both linear and simple non-linear data. With non-linear data, an SVM can use a kernel function to transform the data into a higher-dimensional space, which then makes it easier to linearly separate with a decision boundary line.
3. Work Well With Small Data Sets and Limited Data
SVMs perform best with small data sets, meaning they are able to handle limited data and high-dimensional spaces where data can be sparse.
Disadvantages of Support Vector Machines
1. Can Be Computationally-Intensive
SVM algorithms can be computationally-intensive and slow to execute and train depending on the size of the data set used. Both training time and kernel matrix size increase as data is added, which requires more computer memory.
2. Sensitive to Outliers
Standard SVM algorithms rely on support vector data points to maximize a margin and establish where a decision boundary should be placed in a space. As such, outliers can affect this placement and cause overfitting in some SVMs.
3. Don’t Work Well With Large Data Sets
With some SVMs, the computational power and training time needed for the algorithm quadratically increases as the amount of data increases, making them less practical to use for large data sets.
How to Implement Support Vector Machine in Python
import numpy as np
X = np.array([[-1, -1], [-2, -1], [1, 1], [2, 1]])
y = np.array([1, 1, 2, 2])
We have our points in X, and the classes they belong to in Y. Now, we train our SVM model with the above data set. For this example, I have used a linear kernel.
from sklearn.svm import SVC
clf = SVC(kernel='linear')
clf.fit(X, y)
To predict the class of new data set:
prediction = clf.predict([[0,6]])
How to Set Tuning Parameters for the Support Vector Machine
Parameters are arguments that you pass when you create your classifier. The following are the important parameters for SVM:
1. Set the Value for C
It controls the trade off between smooth decision boundary and classifying training points correctly. A large value of c means you will get more training points correctly.
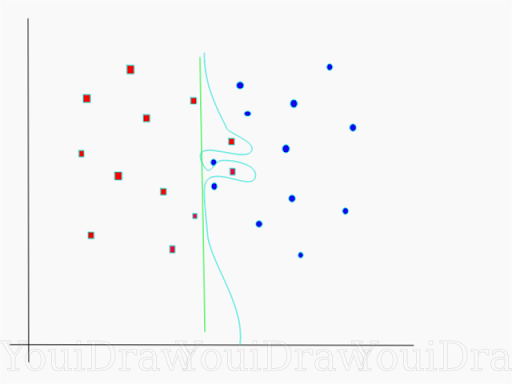
Consider the figure above. There are a number of decision boundaries that we can draw for this data set. A straight, green colored, decision boundary is quite simple, but it comes at the cost of a few points being misclassified. These misclassified points are called outliers.
We can also make something that is considerably more wiggly, the sky blue colored decision boundary, that contains all of the training points. Of course, the trade off of having something that is very intricate and complicated like this is that it’s not going to generalize quite as well to our test set. So something that is simple and straighter may actually be the better choice if you look at accuracy.
A large value of c means you will get more intricate decision curves trying to fit in all the points. Figuring out how much you want to have a smooth decision boundary versus an accuracy is part of the artistry of machine learning. So, try different values of c for your data set to get the perfectly balanced curve and avoid overfitting.
2. Set the Value for Gamma
This defines how far the influence of a single training example reaches. If it has a low value, it means that every point has a far reach, while a high value of gamma means that every point has close reach.
If gamma has a very high value, then the decision boundary is just going to be dependent upon the points that are very close to the line, which results in ignoring some of the points that are very far from the decision boundary. This is because the closer points get more weight, and it results in a wiggly curve, as shown in the previous graph. On the other hand, if the gamma value is low, even the far away points get considerable weight and we get a more linear curve.
I hope this blog post helped in understanding SVMs.
Frequently Asked Questions
What is a support vector machine?
A support vector machine (SVM) is a supervised machine learning algorithm used for classification and regression tasks. It classifies data by outputting an optimal line, or hyperplane, that maximizes the distance between data points of each class in an n-dimensional space.
What is SVM best used for?
SVMs are commonly used for classification and regression tasks in machine learning, such as image classification (i.e. object detection), text classification (i.e. natural language processing, spam detection, sentiment analysis) and bioinformatics (i.e. anomaly detection for genetic analysis and cancer research).
Is SVM better than CNN?
Both support vector machine (SVM) and convolutional neural network (CNN) algorithms can be well-suited for image classification and object detection tasks. However, SVMs tend to be more effective for small to medium data sets and data that can be separated in a linear or simple non-linear way, while CNNs are more effective for large data sets and highly non-linear, complex data.
What is a real life example of SVM?
Some real life examples of SVM applications include facial recognition, handwriting recognition, customer feedback analysis and disease classification and detection.
Why SVM is not good for large datasets?
Large data sets tend to slow down an SVM during training, as SVMs don’t scale well as more data is added. This is due to SVMs being computationally-intensive when training on data, with training time and memory usage quadratically increasing based on the number of data samples.