

Classification problems that contain multiple classes with an imbalanced data set present a different challenge than binary classification problems. The skewed distribution makes many conventional machine learning algorithms less effective, especially in predicting minority class examples. In order to solve this, we need to first understand the problems at hand and then discuss the ways to overcome those obstacles.
What Is Multiclass Classification?
Multiclass classification is a classification task with three or more classes, and makes the assumption that an object can only have one class label. A common example requiring multiclass classification would be labeling a set of fruit images that includes oranges, apples and pears.
What Is Multiclass Classification?
Multiclass classification is a classification task that categorizes data into one of three or more classes, e.g., classifying a set of fruit images that may be oranges, apples or pears. It makes the assumption that each sample is assigned to only one label. For example, multiclass classification assumes a fruit can be either an orange, apple or pear, but not multiple at the same time.
What Is an Imbalanced Data Set?
Imbalanced data typically refers to a problem in classification where the classes are not represented equally. For example, you may have a three-class classification problem for a set of fruits that classify as oranges, apples or pears with 100 total instances. A total of 80 instances are labeled with Class-1 (oranges), 10 instances are labeled Class-2 (apples) and the remaining 10 instances are labeled Class-3 (pears). This is an imbalanced dataset with an 8:1:1 ratio. Most classification data sets do not have an exactly equal number of instances in each class, but a small difference doesn’t often matter. There are problems where a class imbalance is not just common but expected. For example, data sets that identify fraudulent transactions are imbalanced. The vast majority of the transactions will be in the “Not-Fraud” class. And a small minority will be in the “Fraud” class.

Multiclass Classification Data Set Example
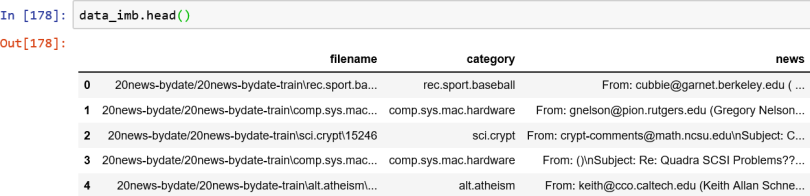
The data set we will be using for this example is the famous “20 Newsgroups” data set. The 20 newsgroups data set is a collection of approximately 20,000 newsgroup documents, partitioned (nearly) evenly across 20 different newsgroups. The 20 newsgroups collection has become a popular data set for experiments in text applications of machine learning techniques, such as text classification and text clustering.
Scikit-learn provides the tools to pre-process the data set. The number of articles for each news group is roughly uniform.

We can remove news articles from some groups to make the overall data set imbalanced like below.

Now our imbalanced data set with 20 classes is ready for further analysis.
Building a Multiclass Classification Model
Since this is a classification problem, we will use a similar approach to sentiment analysis. The only difference here is that we’re dealing with a multiclass classification problem.
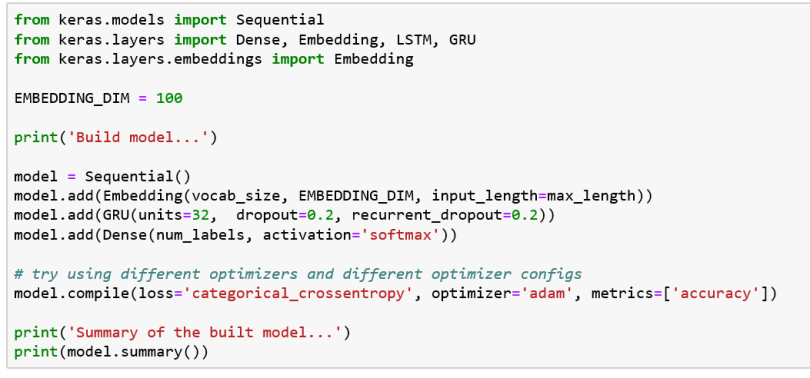
The last layer in the model is Dense(num_labels, activation =’softmax’),with num_labels=20 classes. ‘Softmax’ is used instead of ‘sigmoid’. The other change in the model is about changing the loss function to loss = ‘categorical_crossentropy’, which is suited for multi-class problems.
Training a Multiclass Classification Model
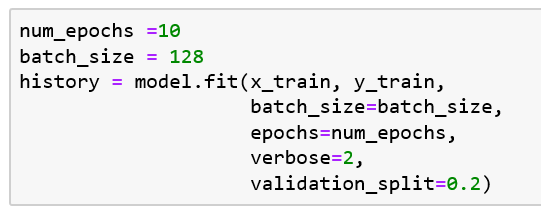
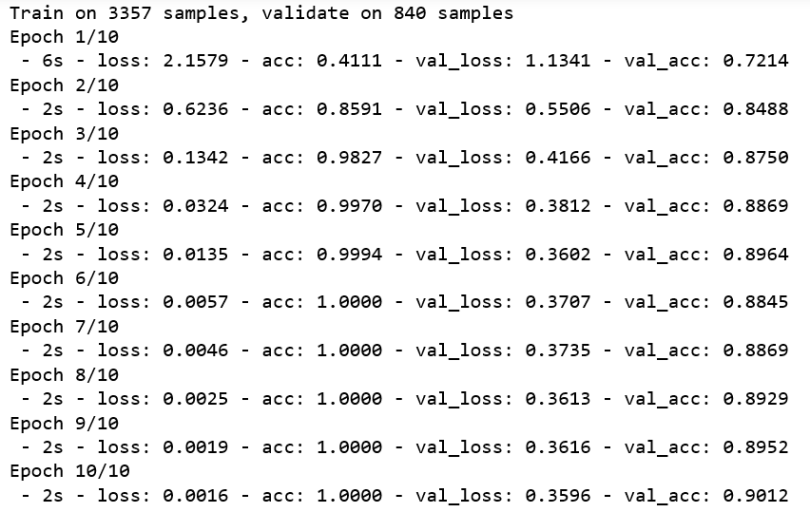
We’re going to train the model with a 20 percent validation set validation_split=0.2, and we’ll be using verbose=2. We’ll see a validation accuracy after each epoch. Just after 10 epochs, we’ll reach a validation accuracy of 90 percent.
Evaluating a Multiclass Classification Model
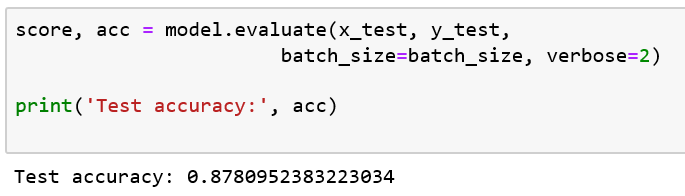
This looks like the model is very accurate, but is it really doing well?
How to Measure a Multiclass Classification Model’s Performance
Let’s consider that we train our model on the imbalanced data from our earlier example of fruits. Since the data is heavily biased towards Class-1 (oranges), the model over-fits on the Class-1 label and predicts it in most of the cases. As a result, we achieved 80 percent accuracy, which seems very good at first, but looking closer, it may never be able to classify apples or pears correctly. Now the question is: If accuracy is not the right metric, then what metrics should you use to measure the performance of the model?
Using a Confusion Matrix
With imbalanced classes, it’s easy to get a high accuracy without actually making useful predictions. So, accuracy as an evaluation metric makes sense only if the class labels are uniformly distributed. In the case of imbalanced classes, a confusion-matrix is a good technique to summarize the performance of a classification algorithm.
A confusion matrix is a performance measurement for a classification algorithm where output can be two or more classes.
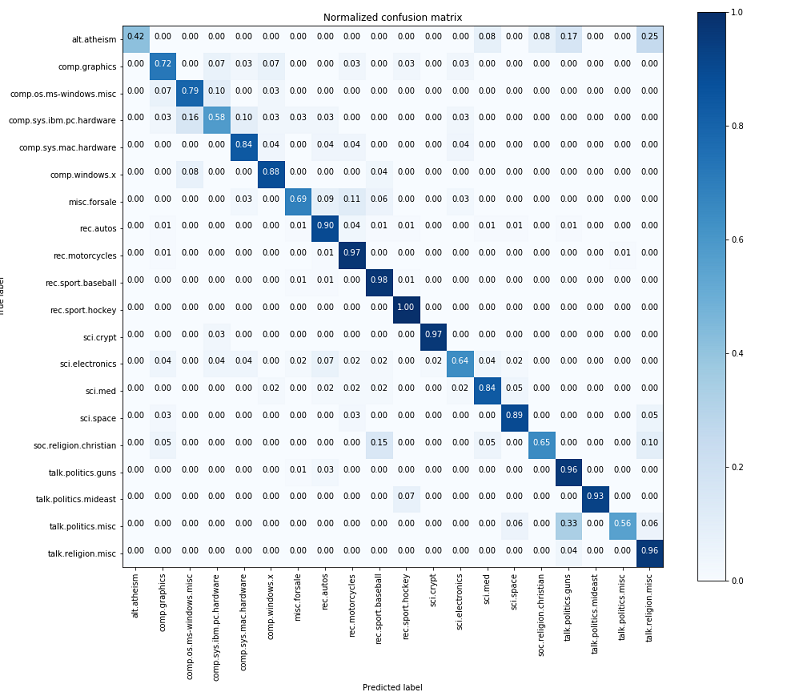
When we look closer at the confusion matrix, we see that the classes (alt.athiesm, talk.politics.misc, soc.religion.christian) which have fewer samples (65,53, 86) respectively have lower (0.42, 0.56, 0.65) as compared to the classes with higher numbers of samples like (rec.sport.hockey, rec.motorcycles.) Looking at the confusion matrix, one can clearly see how the model is performing on classifying various classes.
How to Improve Your Multiclass Classification Model Performance
There are various techniques involved in improving the performance of imbalanced data sets.
Re-Sampling Data Set
There are two strategies to make our data set balanced:
- Under-sampling: Remove samples from over-represented classes.Only do this if you have a huge data set.
- Over-sampling: Add more samples from under-represented classes. Only use this if you have a small data set.
Synthetic Minority Over-Sampling Technique (SMOTE)
SMOTE is an over-sampling method. It creates synthetic samples of the minority class. We use the imblearn Python package to over-sample the minority classes .
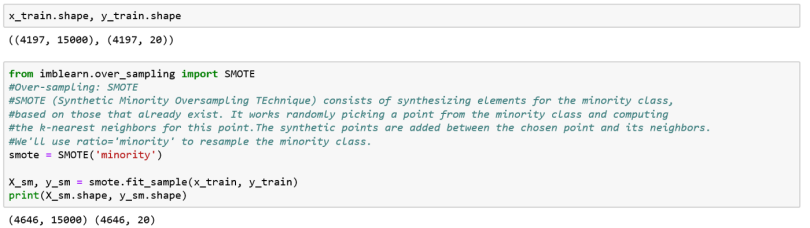
We had 4,197 samples before and 4,646 samples after applying SMOTE. We will now check the performance of the model with the new data set.
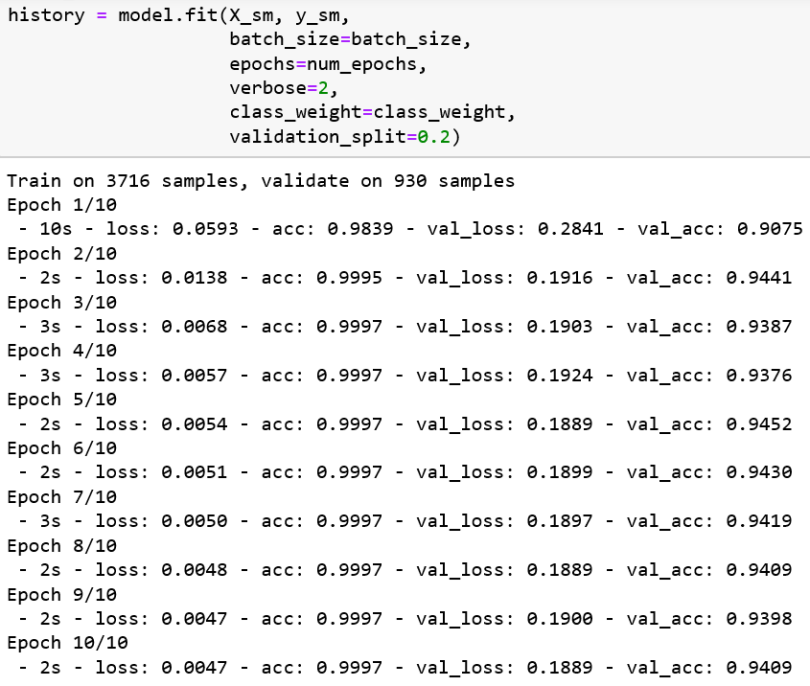
This improved validation accuracy from 90 to 94 percent. Let’s test the model:
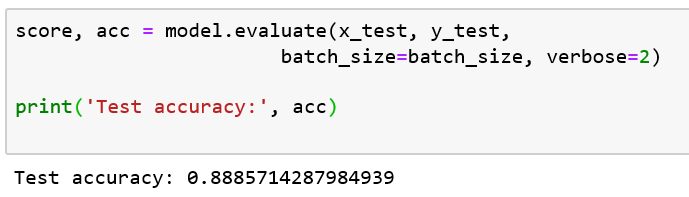
There was little improvement in test accuracy in comparison to before, as accuracy only increased here from 87 to 88 percent. Let’s look at the confusion matrix now.
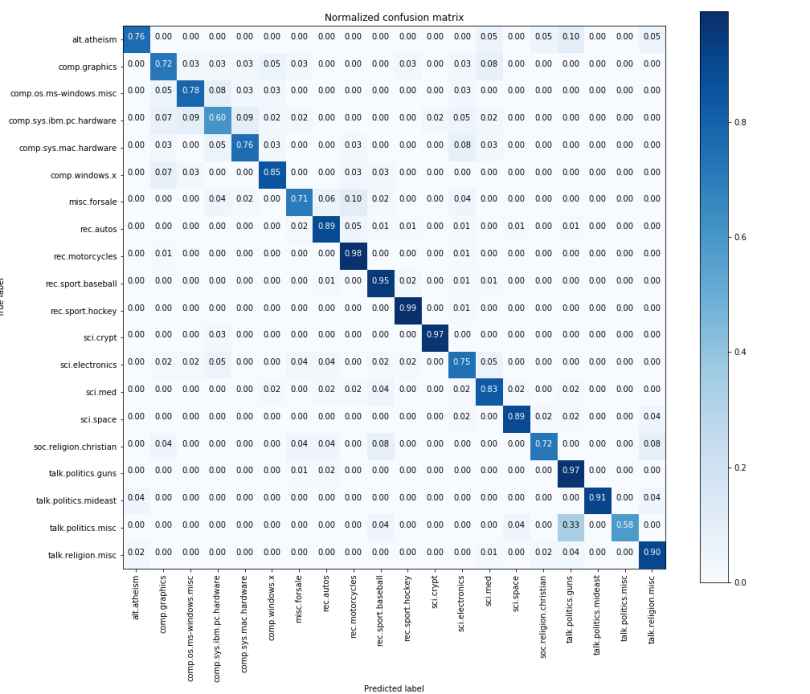
We see that the classes (alt.athiesm, talk.politics.misc, sci.electronics, soc.religion.christian) have improved scores (0.76, 0.58, 0.75, 0.72) than before. Thus, the model is performing better than before, even though accuracy is similar.
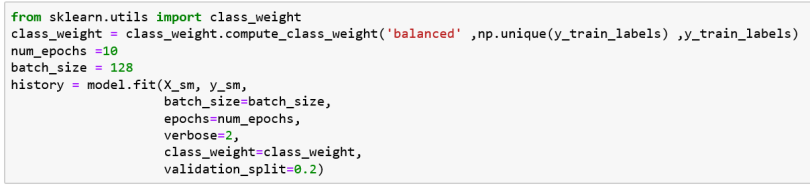
Adjusting Weights for Multiclass Classification
Since classes are imbalanced, what about weighting the loss to compensate for imbalance in minority classes? We can estimate class weights in scikit-learn by using compute_class_weight and using the parameter ‘class_weight’ while training the model. This provides some bias towards the minority classes while training the model, and thus, helps improve the performance of the model while classifying various classes.
Precision-Recall Curves
Precision-recall is a useful measure of success for prediction when the classes are imbalanced. Precision is a measure of the ability of a classification model to identify only the relevant data points, while recall is a measure of the ability of a model to find all the relevant cases within a data set.
The precision-recall curve shows the trade-off between precision and recall for different thresholds. A high area under the curve represents both high recall and high precision, where high precision relates to a low false positive rate, and high recall relates to a low false negative rate.
High scores for both precision and recall show that the classifier is returning accurate results (precision), as well as returning a majority of all positive results (recall). An ideal system with high precision and high recall will return many results, with all results labeled correctly.
Below is a precision-recall plot for 20 Newsgroups data set using scikit-learn.
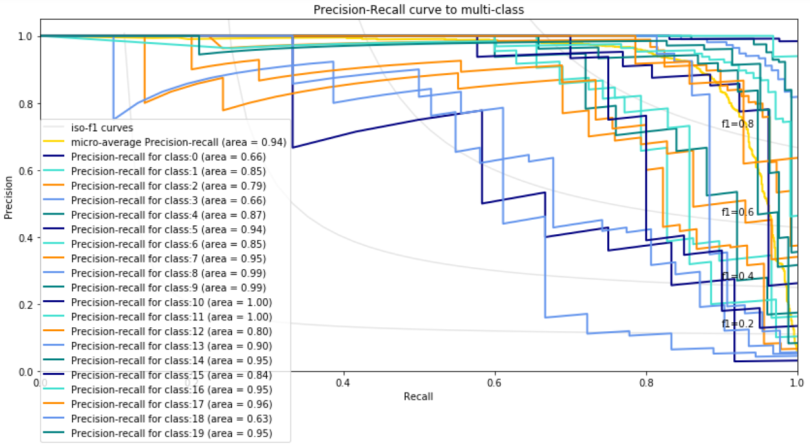
We want to have the area of a precision-recall curve for each class to be close to 1. Aside from classes 0, 3 and 18, the rest of the classes have an area above .75. You can try with different classification models and hyper-parameter tuning techniques to improve the results further.
Frequently Asked Questions
What is multiclass classification?
Multiclass classification is a machine learning task where data is classified into one of three or more classes, with the assumption that each entity can only be assigned to one class label.
How do you perform multiclass classification on imbalanced data?
When performing multiclass classification on imbalanced data, you can use techniques like oversampling (i.e. Synthetic Minority Over-Sampling Technique (SMOTE)), undersampling or class weighting to give more attention to minority classes.


