

Despite the significant overlap in the types of tasks users can perform with them, many Excel users are unfamiliar with Python. Fortunately, Microsoft recently integrated Python with Excel spreadsheets. This upgrade significantly lowers the barrier to entry for Excel users who want to incorporate Python.
Thanks to the new Python/Excel integration, Excel users can explore and analyze data using Python operations within the familiar environment of an Excel spreadsheet. Further, the integrated version of Excel is appropriate for all levels of Python developers and Excel users, whether beginner or advanced. It also doesn’t require the hassles of development environment setup and package installations that often plague Python developers.
Excel Python Function Overview
In order to use Python in Excel, you simply need to use the PY function. This allows you to perform common Python tasks like creating data visualizations, generating descriptive statistics, and training machine learning models.
What Is Python?
Python is an object-oriented programming language used for a wide variety of software tasks. Common applications include web development, scientific computing and research, and data science and machine learning. Python is known for its readability and having a vast community of developers. These qualities make Python a great language for beginners just getting started with software development.
Python is particularly useful for performing data analysis and data manipulation tasks. Because of its utility in these areas, Python is often used in conjunction with other data analysis tools like Excel.
What Is Excel?
Excel is a popular software package for spreadsheet editing. It is commonly used for data-related tasks like data entry, applying formulas for column calculations, sorting and filtering numerical columns, and more. A wide variety of professions use it, including business analysts, sales and marketing teams, data scientists, and many others.
Because of its widespread utility across industries, Excel is the most widely used spreadsheet editor program. Professionals working with data in any capacity most likely will have used Excel. So, given the overlap of their applications, Excel and Python are worth learning for anyone working with data.
Excel Python Function
For those familiar with the Python development community, the Excel/Python integration uses the well-known Anaconda distribution. This configuration is ideal since Anaconda is a secure and trusted enterprise-grade distribution for data analytics.
In order to use Python in Excel, you simply need to use the PY function. This allows you to perform common Python tasks like creating data visualizations, generating descriptive statistics, and training machine learning models.
Specifically, the PY function allows you to use the Python statistical analysis library Pandas. This will allow you to perform Pandas operations like reading data into a Pandas dataframe and performing descriptive statistics calculations like calculating mean, sum, standard deviation and more. You can also execute more complex tasks like performing groupby operations and imputing missing values.
In this post, we will learn how to use Python in Excel. We will use the Excel PY function to perform data analysis using synthetic sales data. In our analysis, we will walk through the steps of importing Python packages, performing descriptive statistics, and generating data visualizations.
How to Import Python Libraries
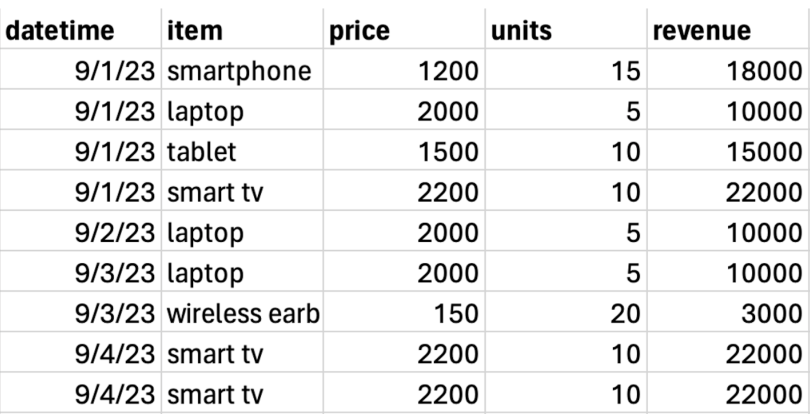
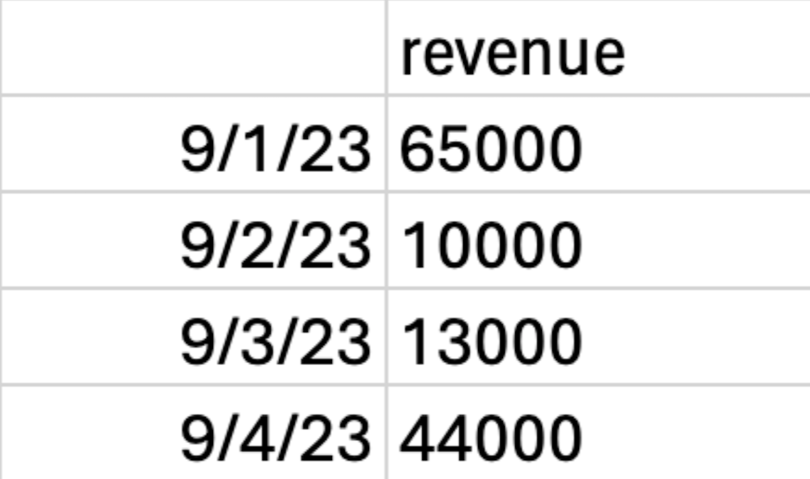
Importing Python packages in Excel is a straightforward process. To do so, let’s open sample electronic product sales data in an Excel spreadsheet:
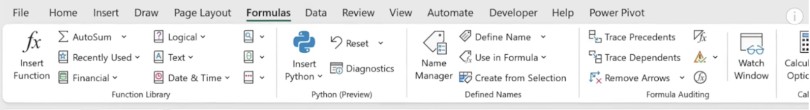
Next, in order to work with Python, we need to navigate to Python mode. We can do this by clicking the Insert Python tab on the top of the spreadsheet:
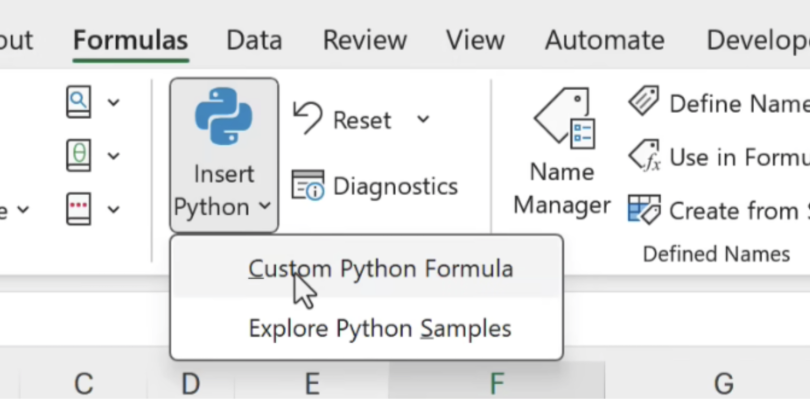
Upon clicking on insert Python, you will see options for Custom Python Formula and Explore Python Samples:
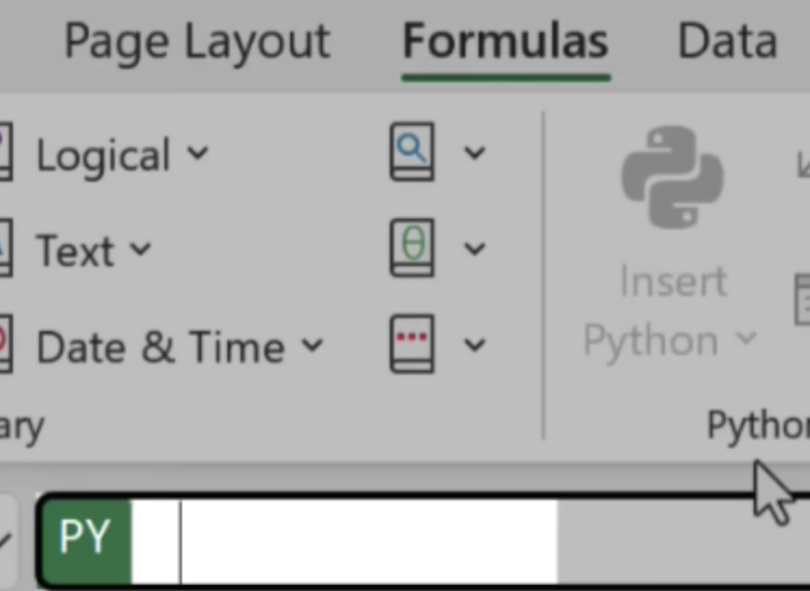
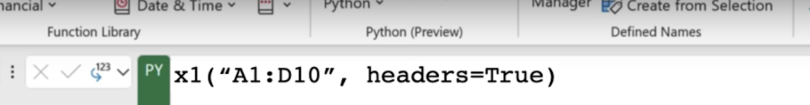
Upon clicking on Custom Python Formula, you should see a green PY pop up on the left side of the formula bar:
Another way to navigate to Python mode is by typing =PY in the formula bar and pressing enter.
By default, Python in Excel contains the following packages:
- Pandas
- Numpy
- Matplotlib
- Statsmodels
- Seaborn
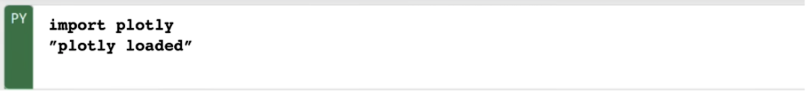
Importing Python packages in Excel is also straightforward. Once you’re in Python mode, in the formula bar, you simply have to type import followed by the name of the package you want to import. For example, to import Plotly, a visualization library that is not included by default, we enter the following:
Another library that isn’t included by default is the regular expression library, which we use for manipulating text data. To import the regular expression library, we do the following:

Python Descriptive Statistics in Excel
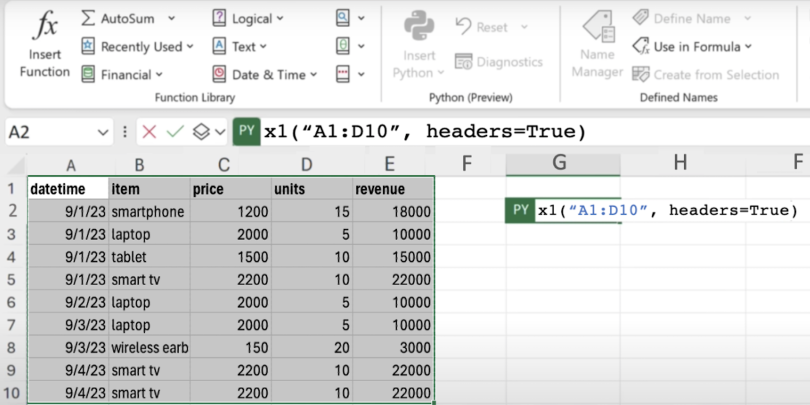
We can easily generate insights from our data using Python logic. To work with our data within Python, while in Python mode, we select the cells we would like to work with:
Using Pandas
To run this logic, we press Control + Enter:
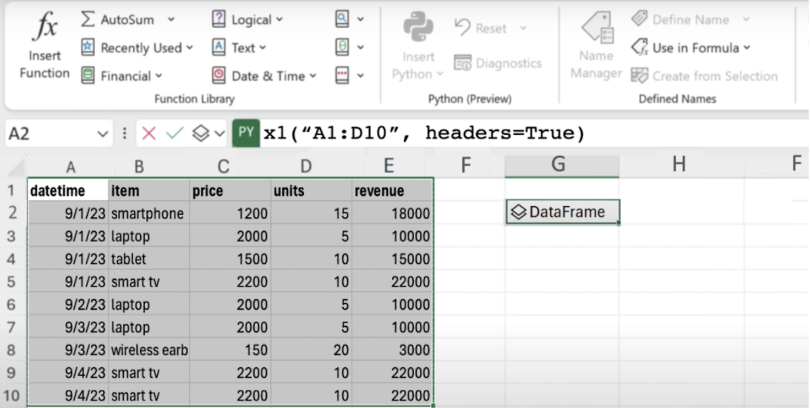
This results in a Pandas dataframe object so we can work with this object in Excel the same way we would in a Python environment.
Describe
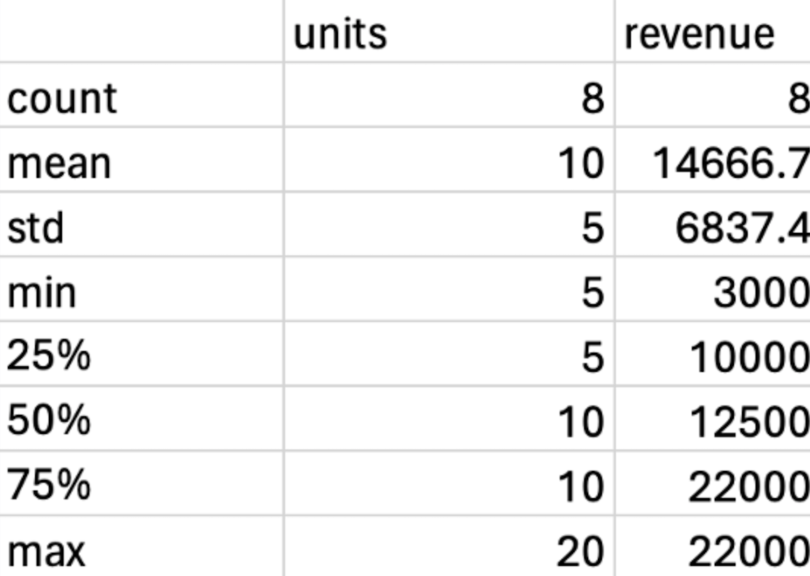
The describe method is a quick and easy way to get high-level insights into your data. Within the Python model, you simply call the describe method on your Pandas dataframe object:
From there, you press Control + Enter to get high-level statistics describing your data. This includes the row count, the mean, standard deviation, quartiles, minimum and maximum values:
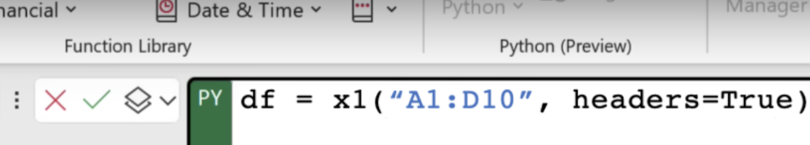
A common practice in Python is to define variables that allow you to reference objects for later use. Let’s store our dataframe in a variable called df
Next, we’ll call the describe method on our dataframe object:
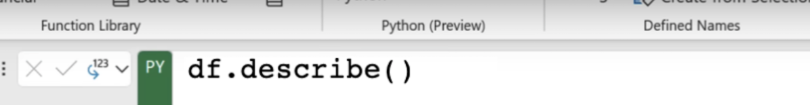
These steps will result in the same output as before.
Sum
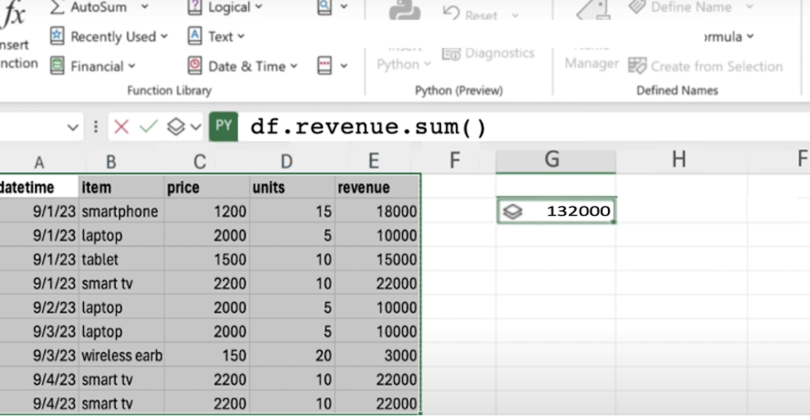
If you’re interested in taking the sum of values in a numerical column, you can use the sum method on the dataframe object:
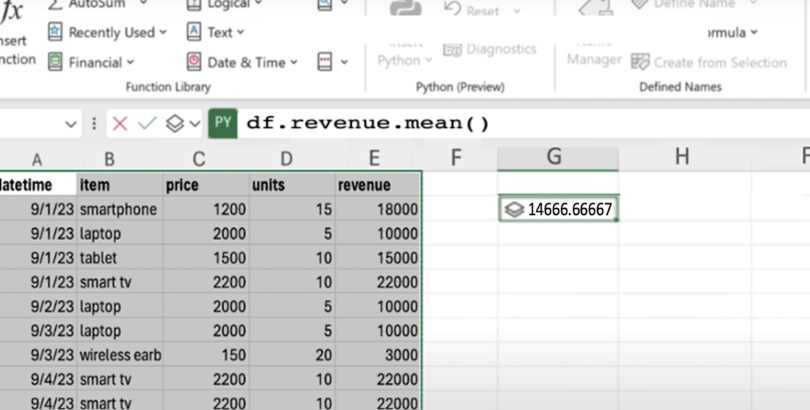
Mean
We can do something similar for calculating the mean of a numerical column. Let’s call the mean method on our dataframe object:
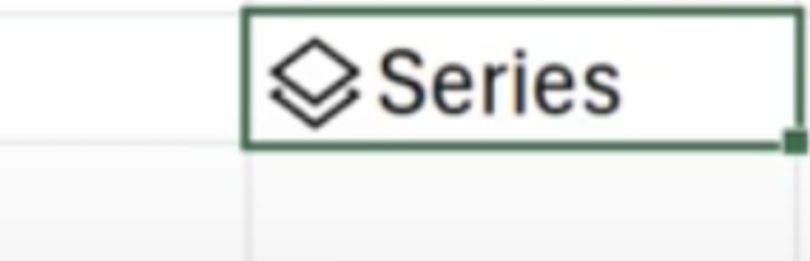
Groupby
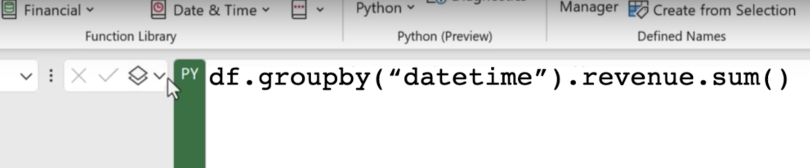
This results in a series object:
We can expand this into Excel values:
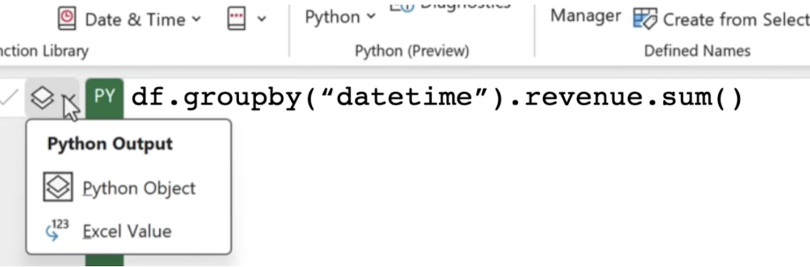
This gives the following output:
Python Plots in Excel
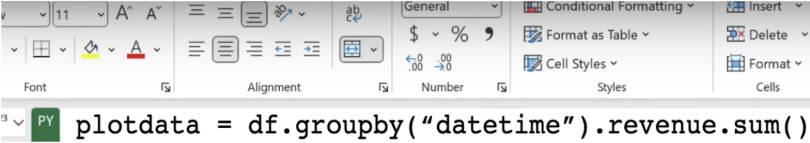
We can use the Pandas plot method to generate a time series line plot of our sales data. Let’s store our grouped data in a variable called plot_data:
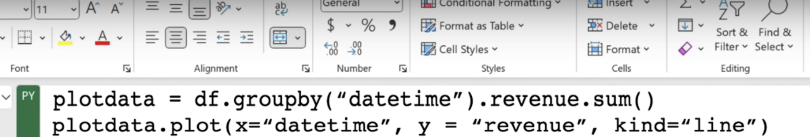
Next, let’s call the plot method on our grouped data. Here, we will specify the x-axis, y-axis and the kind of plot:
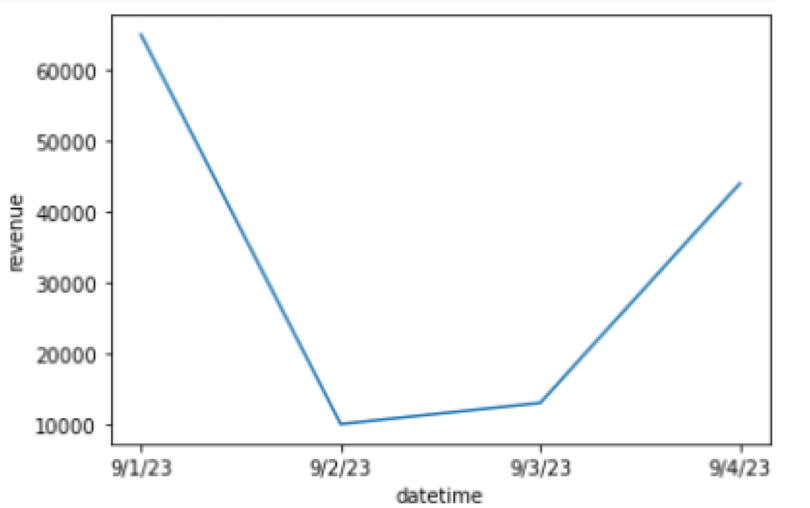
And upon pressing Control + Enter, we generate the following line plot:
The data used in this post is available on GitHub.
Use Python in Excel to Gain Data Insights
Now that Excel enables Python logic within its interface, a wide variety of professionals can draw on the power of Python tools to supplement their day-to-day analytics workflows. Python in Excel is a step towards bridging the gap between analysts who are only comfortable using Excel and Python developers who use these tools to generate analytic insights.
Although we only covered some of the basics here, the capabilities are not limited to these tasks. Given that Excel enables you to import external packages that aren’t provided by default, analysts can use Python tools used for machine learning, natural language processing and more.


