

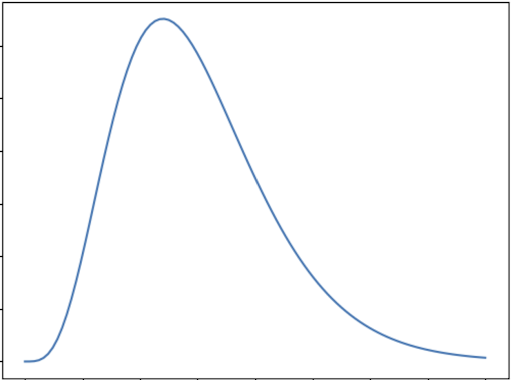
The Gamma distribution is a particular case of the normal distribution, which describes many life events including predicted rainfall, the reliability of mechanical tools and machines, or any applications that only have positive results. Unfortunately, these applications are often unbalanced, which explains the Gamma distribution’s skewed shape.
Gamma Distribution Definition
The Gamma distribution is used to measure continuous variables that possess positive and skewed distributions. As a result, this distribution is ideal for modeling the time between events since time is a continuous variable. Common variables the Gamma distribution can model include rainfall, wait times and failure times.
Gamma Distribution Parameters
When we describe the Gamma distribution, we often use a two-parameter system: the shape and scale parameters. However, in statistics, we can use three parameters to describe the Gamma distribution for a more specific description: the shape, scale and threshold parameters. This means that, if we want to use the two-parameter system, we’ll need to set the threshold parameter to zero.
The Gamma distribution is described using a probability density function (or PDF), which is a formula containing the parameters that affect the distribution’s properties. For example, the PDF of the Gamma distribution looks like this:
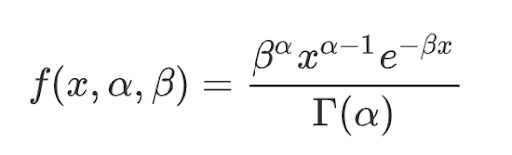
As you can see, the distribution is a function of the shape and scale parameters in the numerator and the Gamma function in the denominator. The Gamma function extends the factorial function to complex numbers and is defined for positive integers and complex numbers.
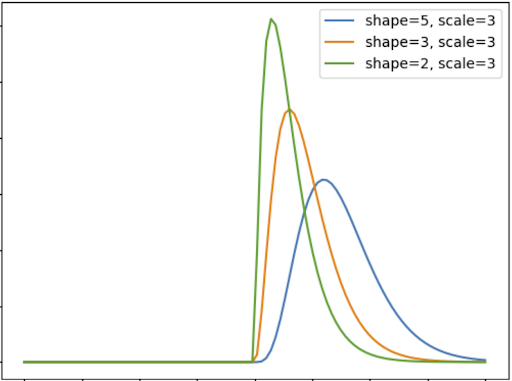
1. The Shape Parameter (α)
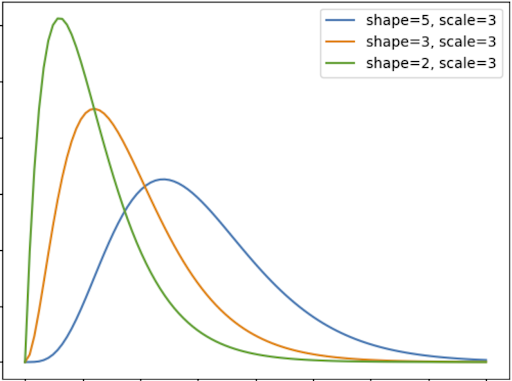
The first of the two Gamma distribution main parameters is the shape distribution (alpha). The shape parameter describes how many events the distribution describes. For example, if we use the Gamma distribution to describe the probability of car accidents in a particular city by modeling four accidents, the shape distribution will be four.
Since the shape distribution is the number of events, it must be positive but not necessarily an integer. If we only change the shape parameter and draw different Gamma distributions, our distribution looks like this:
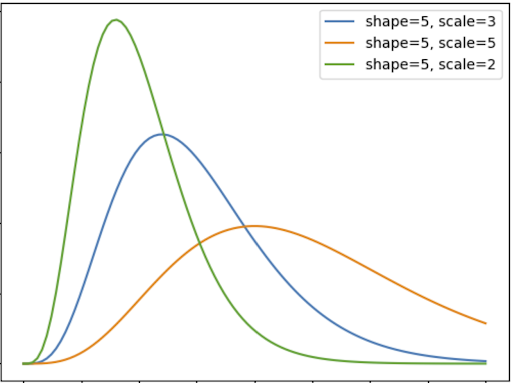
2. The Scale Parameter (β)
The second main parameter is the scale parameter (beta). The scale parameters describe the time interval between the events we are modeling. If we use the car accidents example again, we want to measure the time between the four accidents, so we’ll use the average time between those accidents.
The scale parameter controls the height of the distribution’s peak. The higher the value of the scale distribution, the more spread it will be, which means it will have a lower peak. However, if the scale parameter is small, the distribution will contract and the peak will be larger. If we only change the scale parameter and draw different Gamma distributions, our distribution will look like this:
3. The Threshold Parameter
This parameter controls whether or not the distribution can have negative values. This parameter is often set to zero, which means the distribution can only accept positive values. We do this because negative values are not realistic in most applications wherein we use the Gamma distribution.
So, suppose the other two parameters are fixed. In that case, the threshold parameter shows the distribution values for negative values. But, as you recall, we just said that the Gamma distribution is only for positive values. Hence, the value of the Gamma distribution for negative values is zero.
x values of the Gamma distribution are zero. | Image: Sara A. Metwalli
Properties of Gamma Distribution
If we look at the shape of the Gamma distribution, we can observe the following properties:
- It approaches zero as time tends to infinity (theoretically).
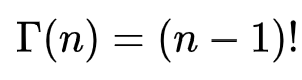
- For real numbers (n), the value of the Gamma distribution is the factorial of (n-1).
- The value of the Gamma distribution of 1/2 is the square root of pi.
When to Use Gamma Distributions
Because time is a continuous variable, Gamma distributions are a perfect fit for modeling time-related scenarios. This includes modeling wait times, the endurance of a piece of equipment and service times.
Time Modeling
You can use a Gamma distribution to model wait times. How long will you need to wait for the next bus or train to arrive if they have a flexible schedule? We can also use the Gamma distribution to calculate the probability that two buses will arrive simultaneously.
Reliability Modeling
We can use the Gamma distribution to measure the reliability of a particular piece of technology and calculate how long a product will last. In other words, how many hours can a device operate before its performance degrades? That new laptop you just bought can run flawlessly for, say, 9,000 hours on average. What is the probability of it functioning properly for the next six to 12 months? How about 12 to 18 months? The Gamma distribution can help us answer these questions.
Queuing Theory
We have all waited in line for food before. How long will the barista take to make your latte? Queuing theory basically simulates a queue of customers requiring a service by considering some parameters such as the capacity of the place of service, the rate of service, the number of employees at a given time, the rate of people joining the line versus those leaving it and so on.
Frequently Asked Questions
What does Gamma distribution tell us?
The Gamma distribution models the time between two events and can be used to anticipate the time until a future event occurs. This makes it ideal for tracking variables with continuous distributions, including cancer rates, service times and rainfall.
What is the difference between normal and Gamma distribution?
Normal and Gamma distributions are both continuous probability distributions, but a normal distribution has a skewness of zero while a Gamma distribution has positive skewness. A normal distribution is then described using its mean and standard deviation while a Gamma distribution is described using its shape and scale.
What is the difference between Beta and Gamma distribution?
Beta and Gamma distributions are both continuous probability distributions, but a Beta distribution has negative skewness while a Gamma distribution has positive skewness. A Beta distribution also has two shape parameters and is ideal for modeling the likelihood of an event succeeding or failing. Meanwhile, a Gamma distribution has shape and scale parameters and is better equipped for modeling the time between two events.


