

Many people learning Python request practical examples so they can learn to program by solving real-world problems. In this step-by-step tutorial, I’ll teach you Python programming, key data science concepts such as multiple regression, and how to automate your analysis by solving a common engineering problem.
We’ll look at several important concepts, such as: how to write Python code to split data files, automate your analysis, check those results for errors, and validate and document a simple simulation model.
Throughout this tutorial, we’ll look at how to create a performance map that will predict the performance of heat pump water heaters as a function of the surrounding conditions. If the technical terms in that sentence don’t mean anything to you, don’t worry. We’ll take this whole process one step at a time.
Steps to Automate Your Data Analysis
- Split your data sets
- Write a program to analyze test results
- Check results for errors
- Validate your results
- Generate regressions in your automated analysis results
First thing’s first: let’s make sure we define our terms.
What’s a Heat Pump?
A heat pump is a device that transfers heat between an energy source and what’s known as a heat sink. One example of a heat pump is the residential air conditioner common in American houses. These devices transfer heat from the source of heat (the building’s interior) to the heat sink (the building’s exterior).
But how does a heat pump do that? How does it transfer heat from a cold space to a hot one? It all happens through the magic of thermodynamics, of course! Here’s a schematic showing the general function of a heat pump.
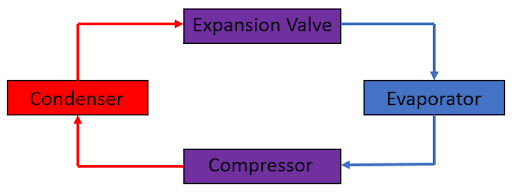
A refrigerant passes through all of the devices listed in above in the direction of the arrows. Refrigerants are heat transfer fluids that increase and decrease in temperature under specific conditions; they’re extremely useful in heat pumps.
The four devices above each put the refrigerant through different processes thereby driving the heat pump. As the refrigerant passes through the system, it experiences the following:
-
Compressor: The compressor is basically a pump. The refrigerant enters the compressor as a gas where it’s pumped to higher pressure. As that happens, the refrigerant gets hot, which leads to a very high temperature gas passing to the condenser.
-
Condenser: The condenser is a heat exchanger connecting the refrigerant to the heat sink. Since the refrigerant is a very high temperature at this point, it loses heat to the heat sink and cools off. In the case of our air conditioner example, the heat sink is the outside air (yes, the refrigerant is hotter than the hot air!). The refrigerant condenses as it passes through the condenser, yielding to a high pressure, moderate temperature liquid.
-
Expansion Valve: The expansion valve directs the refrigerant into a lower pressure environment and condition on the other side, which allows the refrigerant to expand. As the refrigerant expands, it cools further. This yields a low temperature fluid as it’s passed to the evaporator.
-
Evaporator: The evaporator is another heat exchanger but it’s connected to the heat source. In the case of the air conditioner example, this is the low temperature condition inside the house. Since the fluid is so cold it draws heat from the house, increasing the temperature of the refrigerant. As it warms up the refrigerant expands, leading to a cool gas at the compressor.
And then the cycle begins again.
So we’re really talking about three different types of energy transfer. The pump consumes electricity to ensure the refrigerant passes through the cycle. Heat transfers from the refrigerant to the heat sink in the condenser and heat transfers from the heat source to the refrigerant in the evaporator. The amount of heat transferred by the device depends on the heat transfer rates at the condenser and evaporator. As those who’ve studied heat transfer know, the rate of heat transfer at those points is determined by the temperature of the fluid surrounding the condenser and evaporator.
This brings us to the coefficient of performance (COP). The COP states the amount of heat transferred from the heat source to the heat sink relative to the energy consumed by the pump; it’s typically over one. That said, the COP is highly sensitive to the temperatures of the heat source and heat sink. As those temperatures get closer to the refrigerant temperature, less heat will transfer thereby reducing the performance of the heat pump without changing the pumping energy required.
What’s a Heat Pump Water Heater?
HPWHs are a type of heat pump used to heat water. They employ a large storage tank, typically 55 to 80 gallons, holding hot water ready for use when needed. A heat pump transfers heat from the surrounding air (heat source) to the water stored in the tank (heat sink). Here's a HPWH schematic:
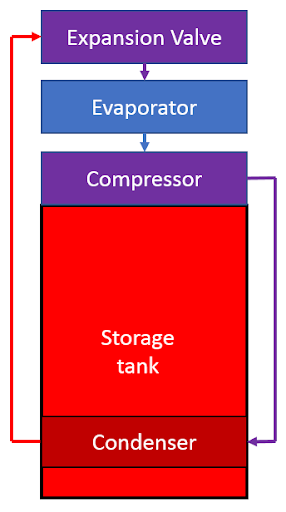
Notice the four parts of the heat pump are the same as the ones with which we’re already familiar. The only real difference here is that the condenser is located inside a hot water storage tank. The hot refrigerant transfers heat to the water in the tank. Meanwhile, the evaporator pulls heat from the surrounding space to the refrigerant so the HPWH transfers heat from the air in the space to the water.
What’s a Performance Map?
We’ve already talked about the COP’s dependence on the temperatures surrounding the condenser and evaporator. This means the coefficient of performance will change as the surrounding temperatures change (and believe me, those temperatures will change!) The outdoor temperature isn’t constant throughout the day and indoor temperature changes as the air conditioner operates.
We can imagine a plot or function stating the coefficient of performance as the two temperatures change.
That’s exactly what a performance map is. A performance map is a way of identifying the performance of a device as the conditions impacting it change. It’s a multi-variable equation expressing the performance of the device as a function of those conditions.
Creating a performance map is a common exercise in scientific and engineering fields. For example, we do this when we create a building energy simulation. Predicting the energy consumption of new buildings, and designing new ways to reduce building energy consumption, is a growing field in the United States.
Engineers use simulation models to predict the performance of the building. Those simulation models need to predict the energy consumed by the equipment installed in the building. Since heat pumps are used in buildings, simulation models need to predict the performance of those heat pumps. How do we predict the performance of those heat pumps? You guessed it: performance maps.
What Comes Next?
The rest of this tutorial will teach you the steps to take a data set of laboratory tests describing the performance of a HPWH under varying conditions and generate a performance map. I’ll also show you how to write the Python code to do that automatically, which will give you the opportunity to learn these skills using a real-world example.
If you’d like to follow along and practice alongside this multi-part tutorial, I’ve created a companion data set you can download. This data set contains fabricated results, emulating what you might receive from a laboratory. It contains quasi-data from three experiments, demonstrating the performance of the heat pump water heater with changes in space and water temperatures.
The next step is to split the data set into independent files so each file provides the result of a single test.
* * *
This multi-part tutorial will teach you all the skills you need to automate your laboratory data analysis and develop a performance map of heat pump water heaters. You can find the rest of the series here:
How to Split Unmanageable Data Sets
These Python Scripts Will Automate Your Data Analysis
How to Check Your Data Analysis for Errors
Don't DIY. Write Python Scripts to Check Data Quality for You.


