


A Gaussian mixture model is a machine learning method used to determine the probability each data point belongs to a given cluster. The model is a soft clustering method used in unsupervised learning.
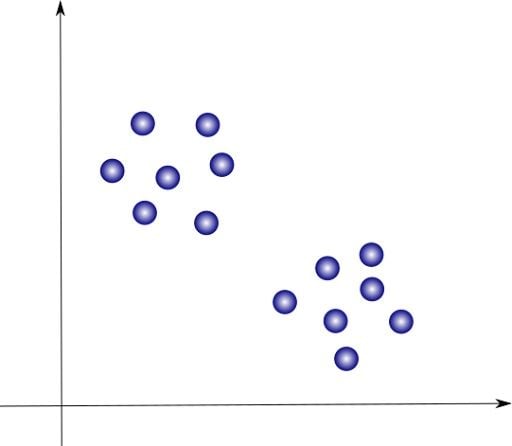
Clustering is an unsupervised learning problem where we intend to find clusters of points in our data set that share some common characteristics. Let’s suppose we have a data set that looks like this:
Gaussian Mixture Model Defined
A Gaussian mixture model is a soft clustering technique used in unsupervised learning to determine the probability that a given data point belongs to a cluster. It’s composed of several Gaussians, each identified by k ∈ {1,…, K}, where K is the number of clusters in a data set.
Our job is to find sets of points that appear close together. In this case, we can clearly identify two clusters of points that we will color blue and red, respectively:
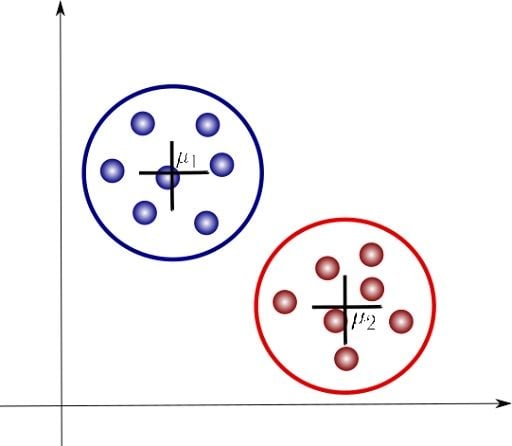
We are now introducing some additional notation. Here, μ1 and μ2 are the centroids of each cluster and are parameters that identify each of these. Let’s look at how a Gaussian mixture model can help us analyze these clusters.
Gaussian Mixture Model vs. K-Means
A popular clustering algorithm is known as K-means, which will follow an iterative approach to update the parameters of each cluster. More specifically, what it will do is compute the means (or centroids) of each cluster, and then calculate their distance to each of the data points. The latter are then labeled as part of the cluster that is identified by their closest centroid. This process is repeated until a convergence criterion is met, such as when we see no further changes in the cluster assignments.
One important characteristic of K-means is that it’s a hard clustering method, which means that it will associate each point to one and only one cluster. A limitation to this approach is that there is no uncertainty measure or probability that tells us how much a data point is associated with a specific cluster. So what about using a soft clustering instead of a hard one? This is exactly what Gaussian mixture models (GMMs) attempt to do. Let’s now discuss this method further.
What Is a Gaussian Mixture Model?
A Gaussian mixture is a function that is composed of several Gaussians, each identified by k ∈ {1,…, K}, where K is the number of clusters of our data set. Each Gaussian k in the mixture is comprised of the following parameters:
- A mean μ that defines its center.
- A covariance Σ that defines its width. This would be equivalent to the dimensions of an ellipsoid in a multivariate scenario.
- A mixing probability π that defines how big or small the Gaussian function will be.
Let’s illustrate these parameters graphically:
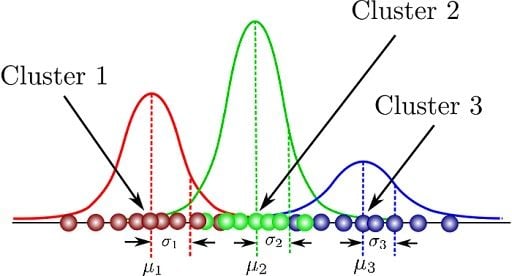
Here, we can see that there are three Gaussian functions, hence K = 3. Each Gaussian explains the data contained in each of the three clusters available. The mixing coefficients are themselves probabilities and must meet this condition:

How do we determine the optimal values for these parameters? To achieve this we must ensure that each Gaussian fits the data points belonging to each cluster. This is exactly what maximum likelihood does.
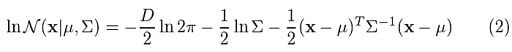
In general, the Gaussian density function is given by:
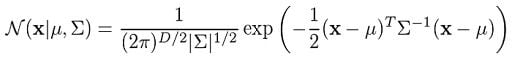
Where x represents our data points, D is the number of dimensions of each data point. μ and Σ are the mean and covariance, respectively. If we have a data set composed of N = 1000 three-dimensional points (D = 3), then x will be a 1000 × 3 matrix. μ will be a 1 × 3 vector, and Σ will be a 3 × 3 matrix. For later purposes, we will also find it useful to take the log of this equation, which is given by:
If we differentiate this equation with respect to the mean and covariance and then equate it to zero, then we will be able to find the optimal values for these parameters, and the solutions will correspond to the maximum likelihood estimation (MLE) for this setting.
However, because we are dealing with not just one, but many Gaussians, things will get a bit complicated when time comes for us to find the parameters for the whole mixture. In this regard, we will need to introduce some additional aspects that we discuss in the next section.
Gaussian Mixture Model Formulas
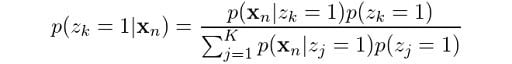
We are now going to introduce some additional notation. First, let’s suppose we want to know what is the probability that a data point xn comes from Gaussian k. We can express this as:

Which reads “given a data point x, what is the probability it came from Gaussian k?” In this case, z is a latent variable that takes only two possible values. It is one when x comes from Gaussian k, and zero otherwise. Actually, we don’t get to see this z variable in reality, but knowing its probability of occurrence will be useful in helping us determine the Gaussian mixture parameters, as we will discuss later.
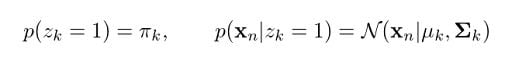
Likewise, we can state the following:

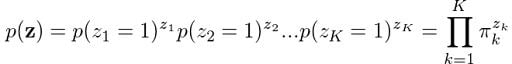
Which means that the overall probability of observing a point that comes from Gaussian k is actually equivalent to the mixing coefficient for that Gaussian. This makes sense, because the bigger the Gaussian is, the higher we would expect this probability to be. Now, let z be the set of all possible latent variables z, hence:

We know that each z occurs independently of others and that they can only take the value of one when k is equal to the cluster the point comes from. Therefore:
What about finding the probability of observing our data given that it came from Gaussian k? Turns out that it’s actually the Gaussian function itself! Following the same logic we used to define p(z), we can state:

You might be wondering why we are doing all this. Remember, our initial aim was to determine the probability of z given our observation x. Well, it turns out that the equations we just derived, along with the Bayes rule, will help us determine this probability. From the product rule of probabilities, we know that:

Now, we are getting somewhere. The operands on the right are what we have just found. Perhaps some of you may be anticipating that we are going to use the Bayes rule to get the probability we eventually need. However, first we need p(xn), not p(xn, z). So, how do we get rid of z here? Marginalization! We just need to sum up the terms on z, hence:
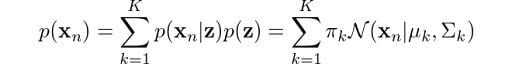
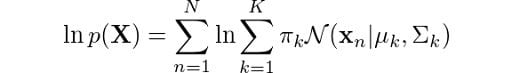
This is the equation that defines a Gaussian mixture, and you can clearly see that it depends on all parameters that we mentioned previously! To determine the optimal values for these we need to determine the maximum likelihood of the model. We can find the likelihood as the joint probability of all observations xn, defined by:
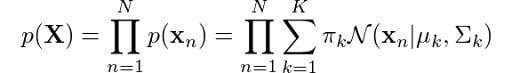
Like we did for the original Gaussian density function, let’s apply the log to each side of the equation:
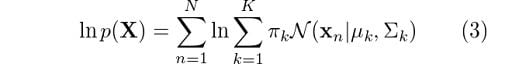
Now, all we have to do is differentiate this equation with respect to the parameters to find the optimal parameters for the Gaussian mixture, right? Not so fast. We have an issue here. We can see that there is a logarithm that is affecting the second summation. Calculating the derivative of this expression and then solving for the parameters is going to be very hard.
What can we do? Well, we need to use an iterative method to estimate the parameters. But first, remember we were supposed to find the probability of z given x? Well, let’s do that since at this point we already have everything in place to define what this probability will look like.
From Bayes rule, we know that:
From our earlier derivations we learned that:
So, let’s now replace these in the previous equation:
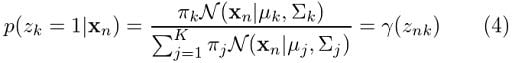
And this is what we’ve been looking for. Moving forward we are going to see this expression a lot. Next we will continue our discussion with a method that will help us easily determine the parameters for the Gaussian mixture.
Gaussian Mixture Model Expectation-Maximization (EM) Algorithm
At this point, we’ve derived some expressions for the probabilities that we will find useful in determining the parameters of our model. However, in the past section, we could see that simply evaluating equation (3) to find such parameters would prove to be very hard. Fortunately, there is an iterative method we can use to achieve this purpose.
It’s called the expectation — maximization (EM) algorithm. It’s widely used for optimization problems where the objective function has complexities such as the one we’ve just encountered for the GMM case.
Let the parameters of our model be:

Let’s now define the steps that the general EM algorithm will follow.
Step 1
Initialize θ accordingly. For instance, we can use the results obtained by a previous K-means run as a good starting point for our algorithm.
Step 2: Expectation Step
Evaluate:

We’ve already found p(Z|X, θ). Remember the γ expression we ended up with in the previous section? For better visibility, let’s bring our earlier equation (4) here:
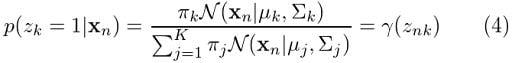
For Gaussian mixture models, the expectation step boils down to calculating the value of γ in equation (4) by using the old parameter values. Now if we replace equation (4) in equation (5), we will have:
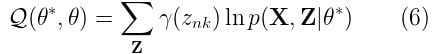
Sounds good, but we are still missing p(X, Z|θ*). How do we find it? Well, it’s actually not that difficult. It’s just the complete likelihood of the model, including both X and Z. We can find it by using the following expression:

Which is the result of calculating the joint probability of all observations and latent variables and is an extension of our initial derivations for p(x). The log of this expression is given by:
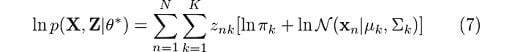
We’ve finally eliminated this troublesome logarithm that affected the summation in (3). With all of this in place, it will be much easier for us to estimate the parameters by just maximizing Q with respect to the parameters. We’ll deal with that in the maximization step. Remember that the latent variable z will only be 1 once each time the summation is evaluated. With that knowledge, we can easily get rid of it as needed for our derivations.
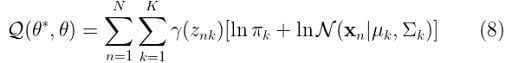
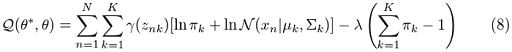
Finally, we can replace equation (7) in (6) to get:

In the maximization step, we will find the revised parameters of the mixture. For this purpose, we will need to make Q a restricted maximization problem and thus we will add a Lagrange multiplier to (8). Let’s now review the maximization step.
Step 3: Maximization Step
Find the revised parameters θ* using:

Where:
Which is what we ended up with in the previous step. However, Q should also take into account the restriction that all π values should sum up to one. To do so, we will need to add a suitable Lagrange multiplier. Therefore, we should rewrite equation (8) in this way:
And now, we can easily determine the parameters by using maximum likelihood. Let’s now take the derivative of Q with respect to π and set it equal to zero:

Then, by rearranging the terms and applying a summation over k to both sides of the equation, we obtain:
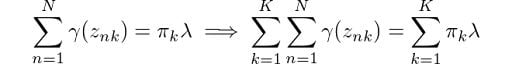
From equation (1), we know that the summation of all mixing coefficients π equals one. In addition, we know that summing up the probabilities γ over k will also give us 1. Thus we get λ = N. Using this result, we can solve for π:

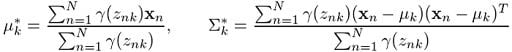
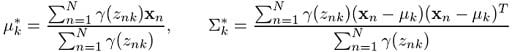
Similarly, if we differentiate Q with respect to μ and Σ, equate the derivative to zero and then solve for the parameters by making use of the log-likelihood equation (2) we defined, we obtain:
And that’s it. We’ll use these revised values to determine γ in the next EM iteration and so on and so forth until we see some convergence in the likelihood value. We can use equation (3) to monitor the log-likelihood in each step and we are always guaranteed to reach a local maximum.
It would be nice to see how we can implement this algorithm using a programming language, wouldn’t it? Next, we’ll use parts of the Jupyter Notebook I have provided so you can see a working implementation of the Gaussian mixture model in Python.
How to Implement Gaussian Mixture Model in Python
I used the Iris data set for this exercise, mainly for simplicity and fast training. From our previous derivations, we stated that the EM algorithm follows an iterative approach to find the parameters of a Gaussian mixture model. Our first step was to initialize our parameters. In this case, we can use the values of K-means to suit this purpose. The Python code for this would look like:
def initialize_clusters(X, n_clusters):
    clusters = []
    idx = np.arange(X.shape[0])

    kmeans = KMeans(n_clusters).fit(X)
    mu_k = kmeans.cluster_centers_

    for i in range(n_clusters):
        clusters.append({
            'pi_k': 1.0 / n_clusters,
            'mu_k': mu_k[i],
            'cov_k': np.identity(X.shape[1], dtype=np.float64)
        })

    return clusters
Next, we execute the expectation step. Here we calculate

And the corresponding Python code would look like this:
def expectation_step(X, clusters):
    global gamma_nk, totals
    N = X.shape[0]
    K = len(clusters)
    totals = np.zeros((N, 1), dtype=np.float64)
    gamma_nk = np.zeros((N, K), dtype=np.float64)

    for k, cluster in enumerate(clusters):
        pi_k = cluster['pi_k']
        mu_k = cluster['mu_k']
        cov_k = cluster['cov_k']

        gamma_nk[:, k] = (pi_k * gaussian(X, mu_k, cov_k)).ravel()

    totals = np.sum(gamma_nk, 1)
    gamma_nk /= np.expand_dims(totals, 1)
In order to calculate the summation, we just make use of the terms in the numerator and divide accordingly.
We then have the maximization step, where we calculate:

The corresponding Python code for this would be the following:
def maximization_step(X, clusters):
    global gamma_nk
    N = float(X.shape[0])

    for k, cluster in enumerate(clusters):
        gamma_k = np.expand_dims(gamma_nk[:, k], 1)
        N_k = np.sum(gamma_k, axis=0)

        pi_k = N_k / N
        mu_k = np.sum(gamma_k * X, axis=0) / N_k
        cov_k = (gamma_k * (X - mu_k)).T @ (X - mu_k) / N_k

        cluster['pi_k'] = pi_k
        cluster['mu_k'] = mu_k
        cluster['cov_k'] = cov_k
In order to simplify the calculations a bit, we have made use of:

Finally, we also have the log-likelihood calculation, which is given by:
The Python code for this would be:
def get_likelihood(X, clusters):
    global gamma_nk, totals
    sample_likelihoods = np.log(totals)
    return np.sum(sample_likelihoods), sample_likelihoods
We have pre-computed the value of the second summation in the expectation step, so we just make use of that here. In addition, it is always useful to create graphs to see how the likelihood is making progress.
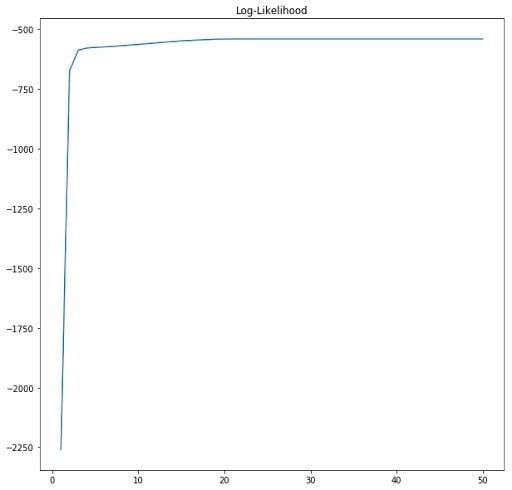
We can clearly see that the algorithm converges after about 20 epochs. EM guarantees that a local maximum will be reached after a given number of iterations of the procedure.
Finally, as part of the implementation we also generate an animation that shows us how the cluster settings improve after each iteration.
See how the GMM improves the centroids estimated by K-means. As we converge, the values for the parameters for each cluster do not change any further.
Understanding Gaussian Mixture Model
Gaussian mixture model is a very powerful tool and is widely used in a variety of data clustering tasks. I would highly encourage you to try the derivations yourself as well as look further into the code.


.jpeg)
.png)