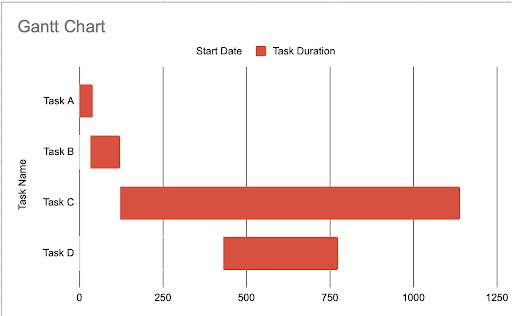
A Gantt chart, frequently used in project management, is one of the most common and effective methods of plotting activities (tasks or events) against time. On every Gantt chart, you’ll see a list of the activities on the chart’s y-axis and a suitable time scale along the x-axis (either on the top or the bottom). Within the chart, you’ll see a horizontal bar that indicates the progress of each activity. The location and length of the bar corresponds to how far along each task is at any given point.
What Is a Gantt Chart Used For?
A Gantt chart is a project management tool used to track the progress of work completed over time in relation to the time planned for that work. It’s a horizontal bar chart to help your team organize projects and improve overall project visibility.
Key Components of a Gantt Chart
The key components of a Gantt Chart are the following:
- Projects: What are the overall projects and tasks this chart will track? Good Gantt charts leverage color to help an observer understand how tasks are paired and what kind of dependencies those pieces have to one another.
- Time: When does a project start and end? Anyone reading a Gantt chart should have a clear understanding of the expected timeline and where each piece of the project is within that timeline.
- Status Bar: Each component of the project has a horizontal status bar that indicates how far along any given task is at a point in time.
- Supplemental Information: What else do we need to know about the project? Good Gantt charts will add supplemental information indicating things like whether a task is higher priority than other tasks, who is responsible for each task and contact information for the responsible parties.
What Are the Benefits of a Gantt Chart?
- A Gantt chart helps you see the work timeline for one or multiple teams. This helps us understand where the team’s resources are going and if there need to be any adjustments.
- A Gantt chart helps a team understand timelines and communicate priorities to other teams. At a glance, a team can see the progress of particular tasks or the entire project and understand dependencies and potential blockages.
- A Gantt chart helps a team track if something is running late and can guide decisions on what to prioritize.
What Are the Disadvantages of a Gantt Chart?
- A Gantt chart may oversimplify the information so it’s important to know that what you are seeing is a representation of time, value or importance.
- A Gantt chart doesn’t show a task’s contextual importance. Without exercising caution, you risk thinking about teams as equal resources and impacting team dynamics to catch up to other team goals.
- A Gantt chart doesn’t drive decision-making but only shows idealized results. If teams do not combine a Gantt Chart with context, they can hurt alignment because it’ll become easy for individuals to look at the chart and walk away with their own (potentially misguided) assumptions about the progress of a project or task.
Types of Gantt Chart Dependencies
- Finish to Start (FS): A task must be completed before the next task begins. (You must complete Task A before you start task B.)
- Start to Start (SS): A task must be started before the next task starts. (You must start Task A before you start Task B.)
- Finish to Finish (FF): A task can only be completed once another task is completed. (You can only complete Task A once you complete Task B.)
- Start to Finish (SF): A task can only be completed once another task starts. (You can only complete Task A once you start Task B.)
How to Make a Gantt Chart
You can create a Gantt chart by simply listing projects with their component tasks, their start and end dates, as well as their dependencies. You can do this on something as simple as an Excel notebook or Google sheet. There are also plenty of tools available to get you started.
Frequently Asked Questions
What is a Gantt chart?
A Gantt chart represents specific tasks as horizontal bars, with the lengths of the bars reflecting how long each task is expected to take. Within this setup, tasks are listed along the y-axis and the duration of each task is marked along the x-axis.
How is a Gantt chart used in project management?
Project management teams use Gantt charts to track the progress of tasks, identify when tasks overlap and take into account any dependencies. This way, teams can ensure they adhere to deadlines and distribute team resources effectively.
What are the key components of a Gantt chart?
A Gantt chart consists of four main components:
- The projects and tasks that need to be completed.
- Timelines for finishing tasks and the project as a whole.
- Status bars that show the progress of each task.
- Supplemental information like priorities, responsibilities and contact info.