

We all know about normal distribution and its ubiquity in all kinds of natural phenomena and observations. But there’s another law of numbers that doesn’t get much attention but pops up everywhere from a country’s population to stock market volumes to the domain of universal physical constants.
Benford’s Law Explained
Benford’s Law states that the first digits found in a data set are expected to be arranged in a way that the lowest digit, one, appears the most frequently, with two appearing the second most, three the third most and so on. This law can help identify patterns and anomalies in naturally occurring data sets, making it useful for applications like detecting fraud.
It is called Benford’s Law. In this article, we will discuss what it is and why it’s important for data science.
What Is Benford’s Law?
Benford’s Law, also known as the “law of first digits” or the “phenomenon of significant digits,” is the finding that the first digits (or numerals to be exact) of the numbers found in series of records of the most varied sources do not display a uniform distribution, but rather, they’re arranged in such a way that the digit one is the most frequent, followed by two, three, and so in a successively decreasing manner down to nine.
It is illustrated in the figure below.

Who Discovered Benford’s Law?
The first record on the subject dates from 1881, in the work of Simon Newcomb, an American-Canadian astronomer and mathematician. Newcomb, while flipping through pages of a book of logarithmic tables, noted that the pages at the beginning of the book were dirtier than the pages at the end. This meant that his colleagues, who shared the library, preferred quantities beginning with the number one in their various disciplines.
In 1938, the American physicist Frank Benford revisited the phenomenon, which he called the “Law of Anomalous Numbers” in a survey with more than 20,000 observations of empirical data compiled from various sources, ranging from areas of rivers to molecular weights of chemical compounds, cost data, address numbers, population sizes and physical constants. All of them, to a greater or lesser extent, followed such an exponentially diminishing distribution.
In 1995, mathematician Theodore Hill finally proved the phenomenon. His proof was based on the fact that numbers in data series following Benford’s Law are, in effect, second-generation distributions, i.e. combinations of other distributions.
Where Does Benford’s Law Occur?
Well, in many places.
It has been shown that this result applies to a wide variety of data sets, including electricity bills, street addresses, stock prices, house prices, population numbers, death rates and lengths of rivers, etc.
In general, a series of numerical records follow Benford’s Law when they:
- Represent magnitudes of events or events, such as populations of cities, flows of water in rivers or sizes of celestial bodies.
- Don’t have pre-established minimum or maximum limits.
- Are not made up of numbers used as identifiers, such as identity or social security numbers, bank accounts, telephone numbers.
- Have a mean which is less than the median, and the data is not concentrated around the mean.
How Does Benford’s Law Apply to Data Science?
Similar to the usage of normal distribution as a tool for reference and gold standard, this law can be utilized to detect patterns, or lack thereof, in naturally occurring data sets. This can lead to important applications in data science, such as catching anomalies or fraud detection.
How to Detect Fraud With Benford’s Law
These days, so much statistical jargon like machine learning and p-values is thrown out at us in popular media that it’s essential we’re able to separate the grain from the chaff.
You can use Benford’s Law to detect potential forgery in data in scientific studies, which mainly build complex regression models and report confidence intervals, and so on.
Suppose, you have a simple one-dimensional data set.

If you are asked to do a proper regression analysis and build a model, you may come up with something like the following:
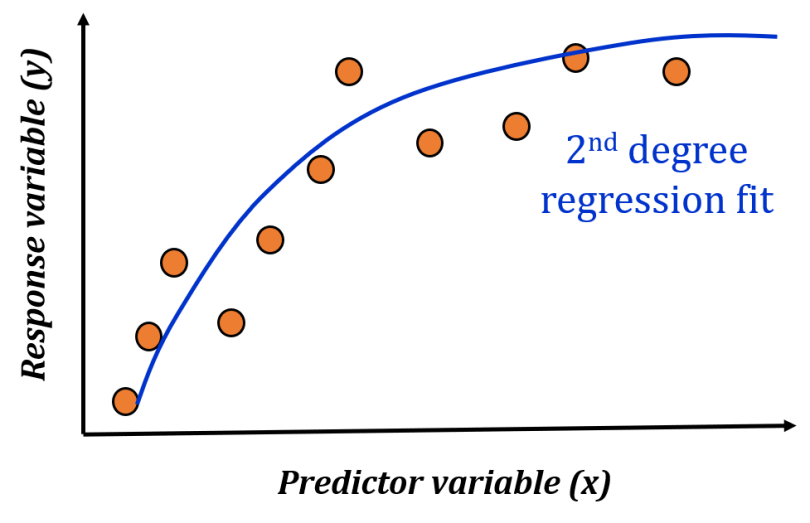
But what if you never did the proper analysis (or regularization), or fudge the data a bit to improve your R² coefficient? For any number of such fraudulent scenarios, you can have various versions of the regression model fit as shown below.

Now, if we do a meta-analysis of such models, we will get various model coefficients that may differ slightly from one another.
It turns out that if your data set comes from naturally occurring phenomena, then with the fraudulent fits, even if you get the first numeral of the regression coefficients right, the subsequent (second and third) numerals may show telltale signs of manufacturing models. The distribution of those second and third numerals is supposed to follow a diminishing power law, even if not exactly Benford’s Law, and if that is not the case, then something could be wrong.
For example, if there are a significantly higher number of eights in the second numerals of the regression model than there are twos, then something is not correct.
Yes, it’s like detective work pouring through the fine details of machine learning models and their coefficients, extracting numerals and checking to make sure they follow the expected distribution.
Applying Benford’s Law to Business Analytics
One area where unscrupulous professionals regularly try to manufacture data is in the financial statements of a business.
When we try to conjure up supposedly random numbers in our head, we tend to think in terms of uniform distribution, or at the most, Gaussian distribution. We certainly don’t think in terms of geometric distribution, which the law closely follows.
So, a fraudster may be caught if a machine analyzes the supposedly random numbers he tried to insert in a business document.
This article shows how the same law can be used effectively to detect financial statement fraud. While Benford’s Law should not be used as a final decision-making tool by itself, it may prove to be a useful screening tool to indicate that a set of financial statements deserves a deeper analysis.
When Not to Apply Benford’s Law
Keep in mind that Benford’s Law doesn’t work for every situation. For example, distributions that have set minimum and maximum values don’t work well with Benford’s Law because they are restricted. This includes variables like human weights, human ages and SAT scores. In addition, Benford’s Law doesn’t apply to numbers that are randomly assigned, including zip codes, phone numbers and ID numbers.
Only use Benford’s Law for data that is measured instead of assigned — especially for data with a really wide range, data with no minimums or maximums and larger volumes of data.
Why Benford’s Law Is Important
Science, technology and business publications are not above suspicion and second screening today. It’s an unfortunate but true development. In this era of Big Data, we are inundated by statistical models and conclusions. These studies, models, and their conclusions affect our society deeply, in an all-encompassing way from healthcare to economics to social interaction and technological research. It is even more disheartening to see that basic science research publications, which are supposed to report the pure objective truth, are not above such dishonesty and fraud.
We need effective screens and sound analytical techniques to judge the veracity of these models and research publications. In this article, we discussed one such statistical law and its utility for detecting anomalies in number patterns.
Frequently Asked Questions
What is Benford’s Law?
Benford’s Law states that the lead digit in a data set is more likely to be a digit of smaller value than a digit of larger value. The digit with the smallest value, one, appears the most frequently as the lead digit, while the digit with the highest value, nine, appears the least frequently.
How is Benford’s Law used?
In data science, Benford’s Law is used to help discern patterns in data and identify anomalies. This makes it useful in areas like finance and the stock market, where it can help detect fraudulent activity.
Does Benford’s Law apply to all types of numbers?
No, Benford’s Law does not apply to all types of numbers. For example, it doesn’t work for numbers with a restricted range like human ages or SAT scores. It also doesn’t apply to numbers that are randomly assigned like zip codes and ID numbers.


