
")
Waikato Environment for Knowledge Analysis, otherwise known as Weka, is a collection of data visualization and algorithm tools built on top of Java. Don’t worry though! You don’t have to know any Java to make use of Weka thanks to its graphical user interface (GUI). Using this GUI, you can run the popular machine learning models on data without writing any code!
Before getting your hands dirty with Weka, however, you’ll need to learn some basics of machine learning algorithms.
Key Machine Learning Concepts
- Data
- Regression
- Classification
Machine Learning Basics
Data
Before you can start running machine learning algorithms, you’ll need a data set. A great place to find one is Kaggle, a website for data scientists containing challenges, data sets and more. Simply search for a data set in your area of interest and download it! I’ll be using the iris flower data set if you want to follow along.
I recommend looking for data sets in the CSV format for the easiest implementation. For the uninitiated, CSV stands for comma-separated values and is a simple text document where each line is a row of a table and commas separate the columns.
After you download your CSV file, open it in a text editor to look at the format.
Data Types
Data can be in various types. I’ll introduce you to the data types most valuable to Weka. The important data types are numeric, string and class. As you might expect, numbers comprise a numeric data type. For example, any of the continuous values identified for regression are numeric. String data is text; words, sentences and paragraphs are all string data types. Finally, class data is data that has predefined categories or a list. For example, an IMDB star rating or species of dogs. These three data types make up the majority of data.
Regression
Regression is one machine learning method you’ll be learning in this guide. Regression problems focus on predicting a continuous number. For example, the number of likes on a Facebook post or the selling price of a house. Take a look at the data set you got from Kaggle and try to identify any regression problems by looking for continuous values and decide if they would be valuable to predict.
Classification
Classification is the other machine learning method you’ll learn here. Classification problems predict the category of a record. For example, is this flower a rose? Or, is this drink a soda? Take a look at your data set and try to identify any classification problems by looking for categories and decide if they would be valuable to predict.
How to Build a Machine Learning Model in Weka
Now that you have a better idea of some of the basic terminology used in machine learning, let’s get started on building your first model.
The first step is to download the Weka GUI. After installing the program you should see the window below.
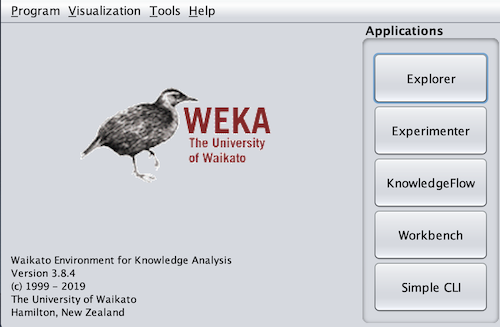
There are five main areas of the Weka GUI. At the start, you can ignore all but the explorer section until you have additional experience in Weka. Click on the explorer button to get to the screen below.

Explorer has seven tabs: preprocess, classify, cluster, associate, select attributes, visualize, and forecast. We’ll stick to the preprocess (shown above) and classify tabs. This is where you’ll load in your data. However, we’ll need to transform the CSV data set into an ARFF file. To do this, you’ll need a text editor and Sublime Text. After downloading Sublime, open your CSV file in a text editor and copy the contents. Then, paste them into a new Sublime file. Save this file and name it with .arff at the end.
ARFF files have three sections: relation, attributes and data. We’ll need to add these sections to the file. On the first line add the relation component and name your data set.
@RELATION irisSkip a line and then add the attributes component. Your attributes will be the columns of the data set. Each attribute requires a name and the data type. When inputting a class data type, list each category separated by a comma within curly brackets.
@ATTRIBUTE Id NUMERIC
@ATTRIBUTE SepalLengthCm NUMERIC
@ATTRIBUTE SepalWidthCm NUMERIC
@ATTRIBUTE PetalLengthCm NUMERIC
@ATTRIBUTE PetalWidthCm NUMERIC
@ATTRIBUTE Species {Iris-setosa, Iris-versicolor, Iris-virginica}
Skip another line, and then add the data component above your CSV data you copied. Make sure to delete the header row if your data has one.
@DATA
1,5.1,3.5,1.4,0.2,Iris-setosa
2,4.9,3.0,1.4,0.2,Iris-setosa
3,4.7,3.2,1.3,0.2,Iris-setosa
4,4.6,3.1,1.5,0.2,Iris-setosa
5,5.0,3.6,1.4,0.2,Iris-setosa
6,5.4,3.9,1.7,0.4,Iris-setosa
7,4.6,3.4,1.4,0.3,Iris-setosa
8,5.0,3.4,1.5,0.2,Iris-setosa
....
Finally, save this file again and you are ready to load it into Weka.
On the preprocess tab in Weka, click open file and navigate to your new ARFF file.

You will know the data has been imported correctly if you see a distribution graph in the bottom right corner of the preprocess tab.

After loading in the data, click on the classify tab. This is where we’ll run both regression and classification models (regression models also run here despite the name “classify”).
You should see the screen below.
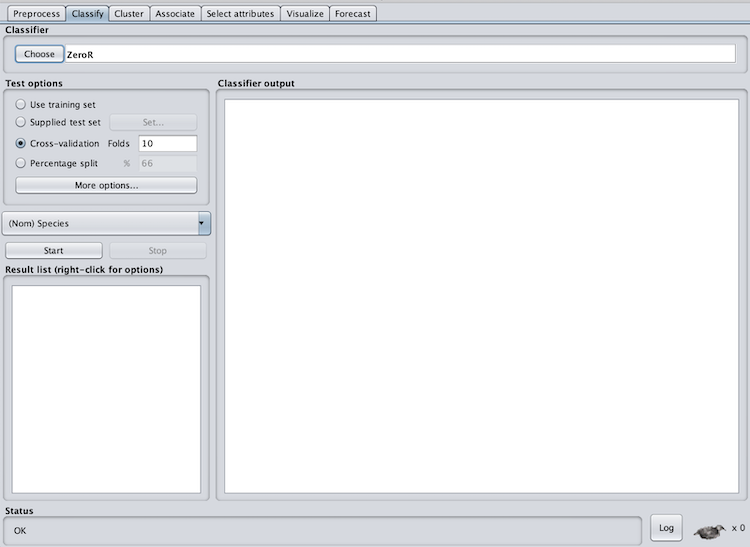
In the test options section, we have four options: use training set, supplied test set, cross-validation and percentage split. In order to gauge the accuracy of the model for predicting the chosen column, we need to supply new data it hasn’t seen before. One way to do this is to break your data set into two pieces called test and train.
However, I recommend using cross-validation with 10 folds. This will split the data set into a test and train (with 10 percent of the data used for testing) 10 times. This is usually the best practice.

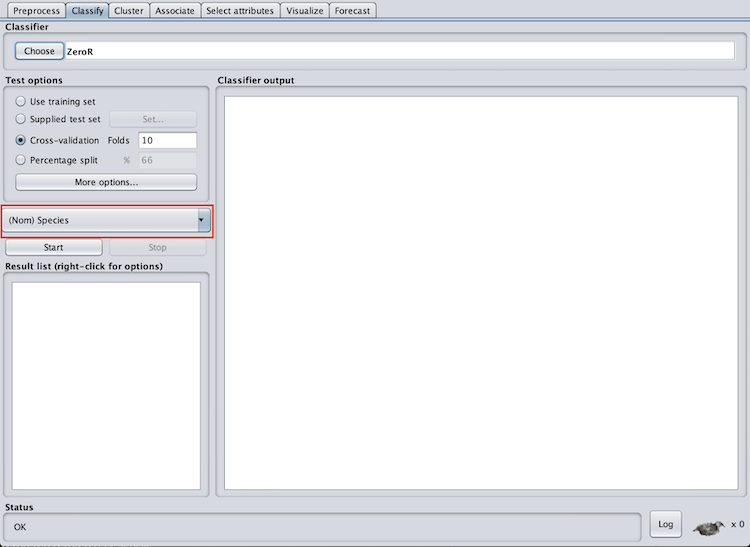
We also need to select the column we want to predict. For the iris data set, I’ll use the flower species, however, you should use the columns you identified when exploring your own data set.
We then need to select the machine learning algorithm we will use. Because the iris species is a classification problem, I will use classification algorithms. One of the basic classification algorithms is logistic regression (don’t be confused by the “regression” in logistic regression — it is a classification algorithm).
Logistic regression will output a number between zero and one to classify the record. I’ll skip the math for now but understanding how these algorithms work is extremely important. To select the logistic regression algorithm click on choose under classifier and then logistic under classifiers > functions.

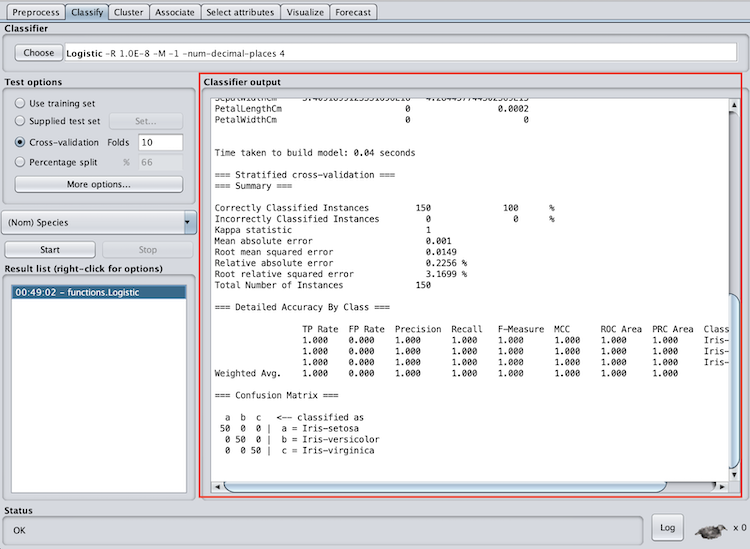
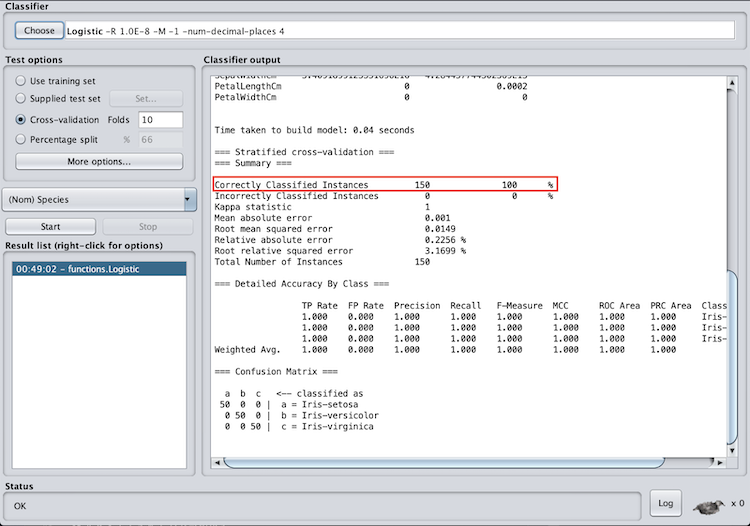
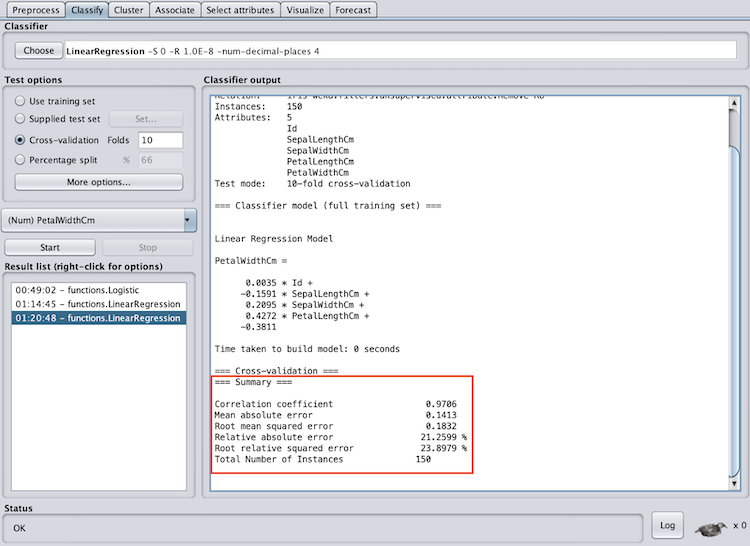
Now, all we have to do is hit start. After the model begins running you should get an output similar to the one below.
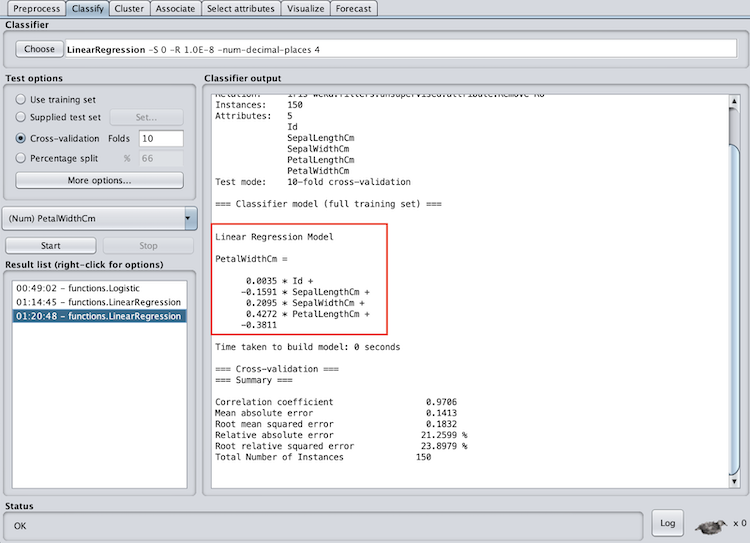
If you’re doing a regression problem the process is the same. However, instead of choosing logistic under classifiers > functions choose LinearRegression. Like with logistic regression, I’ll skip the math on linear regression for now. Now you may be saying: “Great! I got the model to run ... but now what?” After running your model you need to learn how to read the output and evaluate the model’s success.
Machine Learning Model Evaluation in Weka
Weka’s output will differ for both classification and regression problems. However, understanding how to read and interpret Weka’s output is important in order to understand how well your model predicted. We’ll go through the output for both classification and regression problems.
Classification Model Evaluation in Weka
There are three important sections in Weka’s classification output for evaluating the success of the model. These are summary, accuracy by class, and confusion matrix.
In the summary section, pay attention to the correctly classified instances. This is how many records the model correctly classified, and can be represented as a percentage. In the case of the iris data set, we correctly classified 100 percent of the records. This is extremely rare with real-world data sets, so don’t expect your accuracy to be this high. Good accuracy varies by data set and application area, however, if your accuracy is lower than random chance, there are definitely some improvements you need to make.
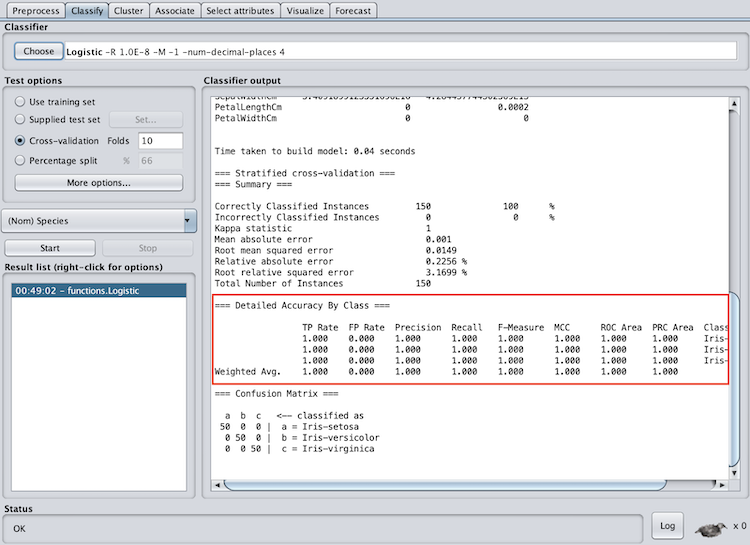
In the accuracy by class section, pay attention to the f-measure and ROC area. The f-measure is a metric between 0 and 1 is the harmonic mean of precision and recall, so it takes both into account. When evaluating the f-measure, the closer to one it is, the better the model performed. The ROC area is the area under a receiver operating characteristics curve. This output will be between zero and one and will denote how well the model can distinguish between classes.
When evaluating the ROC area, the closer the number is to one the better. You can also see that Weka provides an f-measure and ROC area for each class as well as a weighted average. I recommend paying attention to the weighted average to evaluate the model as a whole, however, if you have multiple classes this can help identify classes the model had specific trouble classifying.
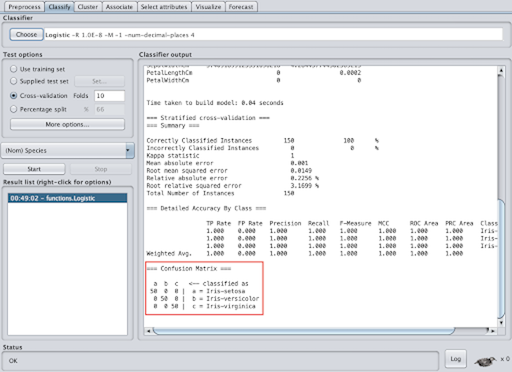
The confusion matrix is also an important evaluation feature. In this matrix, the top row denotes what the record was classified as and the side column denotes what class the record actually was. The diagonal shows the records that were correctly classified. A confusion matrix can help you identify records that the model is having difficulty classifying.
Regression Model Evaluation in Weka
Weka’s regression models have one evaluation section — summary. However, if you run linear regression, you will also have a section called linear regression model. Now, I know I said I would skip the math on linear regression, but hang on for a second. Linear regression will create a linear function that best represents the data (think best-fit line). The linear regression model section shows what function the model came up with. For example, with the iris data set, the linear regression function to predict petal width is:
PetalWidthCm = 0.0035 * Id -0.1591 * SepalLengthCm +0.2095 * SepalWidthCm + 0.4272 * PetalLengthCm -0.3811
The summary section will provide metrics to evaluate the success of the model. The correlation coefficient will tell you how much of a linear association there is between the variables. The closer the correlation coefficient is to one the better. In addition, the mean absolute error will tell you the absolute value of the average error (over or under-predicted). The absolute value is used to capture negative errors. A lower mean absolute error is better, however, what “lower” is will depend on the data and require some intuition.
Machine Learning for Beginners: Next Steps
This is by no means an all-inclusive guide to machine learning, Weka or even the methods explored above, but it should get you up and running on making actual predictions with actual data. Weka is a great place to start exploring machine learning because you can implement common algorithms without writing any code.
You can also grow your skills with Weka to use more advanced methods. Some additional algorithms you can use for classification are C4.5 decision tree (known as J48 in Weka), random forest, and naive Bayes. If you are feeling confident, Weka also has a support vector machine (SVM) implementation under the name SMOreg, which is used for regression — so choose your kernel carefully.
Frequently Asked Questions
How can beginners start learning machine learning?
Machine learning beginners can start learning about the subject by exploring core concepts like regression, classification and data types used in machine learning. Using tools like Weka, which offers a graphical user interface, also makes it possible to build and evaluate models without writing code.
What is Weka and why is it recommended for beginners?
Weka (Waikato Environment for Knowledge Analysis) is an open-source machine learning platform built in Java. Its visual interface lets users run machine learning algorithms — such as logistic regression or linear regression — on data sets without requiring programming knowledge.


