Networks are all around us — road networks, internet networks and online social networks like Facebook. While this article focuses on social network analysis (SNA), these techniques will give you valuable tools to gain insight on a variety of data sources.

In order to build SNA graphs, we need two key components: actors and relationships. We commonly use SNA techniques with the internet. Web pages often link to other sites — either on their own website or an external page. These links can be considered relationships between actors (web pages) and this is a key component of search engine architecture.
What Is Social Network Analysis?
What Does a Social Network Graph Look Like?
A social network graph contains both points and lines connecting those points — similar to a connect-the-dot puzzle. The points represent the actors and the lines represent the relationships. An example of a social network graph would be this one, which demonstrates community detection of ISIS Twitter accounts.

What Tools Do I Need to Get Started?
Like many things in data science, there are a variety of tools you can use to conduct SNA. This guide focuses on a specific set of tools in order to get you started making network graphs and conducting analysis on them. In no way are these the only or best tools available.
Gephi
We’ll use Gephi, a free software for Mac, PC, and Linux, in order to build network graphs and run some analytics on them. Gephi provides a GUI interface (seen below) and will not require any coding.

Python/Excel
In order to build network graphs in Gephi, we’ll need to use a specific data format and we’ll need to fit our data in the correct format (CSV files). With simple data, Excel should suffice. However, when using large amounts of data or data that must have its relationships extracted, I recommend Python. Don’t fret if you don’t have any Python skills — you should still be able to build basic networks.
Data Source
You’ll also need a data source for your network. Network data have two requirements: actors and relationships. Some data will require these relationships to be extracted, and others will be more explicit. I recommend using data sets from Kaggle to get started, such as:
Defining Our Terms
Nodes and Edges
Up until now, I’ve referred to both actors and relationships. In network science, actors are referred to as nodes (the dots on the graph) and relationships as edges (the lines on the graph).

Nodes can represent a variety of actors. For example, in internet networks nodes can represent web pages while in social networks nodes can represent people. While nodes can represent a variety of things, each node always has a relationship with another thing.
Edges can represent a variety of relationships. In internet networks, edges can represent hyperlinks and in social networks edges can represent connections. Nodes and edges are a key concept in networks, so make sure you have a good understanding of them before tackling the other concepts.
Edge Direction
There are two types of edges: directed and undirected. It will be necessary to decipher what type of edge your data contains when building a network graph.
Directed edges are applied from one node to another with a starting node and an ending node. For example, when a Twitter user tags another Twitter user in a tweet, that relationship is directed. The user who wrote the tweet (starting node) applied that relationship to the user who they tagged (ending node). The tagged user has not necessarily reciprocated that relationship. Another example of a directed edge are payments. If a customer (starting node) pays a coffee shop (ending node) for a coffee, that relationship is not necessarily reciprocated because the coffee shop has not also paid the customer.

Undirected edges are the opposite of directed edges. These relationships are reciprocated by both parties without a clear starting node or ending node. For example, if two people are friends on Facebook, that relationship is undirected. This is because person A is friends with person B, but we can also say person B is friends with person A.
Edge Weight
An edge’s weight is the number of times that edge appears between two specific nodes. For example, if person A buys a coffee from a coffee shop three times, the edge connecting person A and the coffee shop will have a weight of three. However, if person B only buys coffee from the coffee shop once, the edge connecting person B and the coffee shop will have a weight of one.
Centrality Measures
Centrality is a collection of metrics used to quantify how important and influential a specific node is to the network as a whole. It’s important to remember that centrality measures are used on specific nodes within the network, and don’t provide information on a network level. There are several centrality measures, but this guide will cover degree, closeness and betweenness.
Degree
A node’s degree is the number of edges the node has. In an undirected network, there’s only one measure for degree. For example, if node A has edges connecting it to node B and node D, then node A’s degree is two.

However, in a directed network, there are actually three different degree measures. Because these edges have a starting and end node, the in-degree (number of edges the node is an end node of), out-degree (number of edges a node is a starting node of), and degree (number of edges a node is either a starting node or end node of) can be calculated.
Closeness
Closeness measures how well connected a node is to every other node in the network. A node’s closeness is the average number of hops required to reach every other node in the network. A hop is the path of an edge from one node to another. For example, node A is connected to node B, and node B is connected to node C. For node A to reach node C it would take two hops.

Betweenness
Betweenness measures the importance of a node’s connections in allowing nodes to reach other nodes (in a hop). A node’s betweenness is the number of shortest paths the node is included in divided by the total number of shortest paths. This will provide the percentage of shortest paths in the node’s network.
Network-Level Measures
We can also calculate metrics on the network level to evaluate the entire network instead of merely a single node. Like centrality measures, there are a variety of network-level measures. We’ll look at size and density.
Network Size
Network size is the number of nodes in the network. The size of a network does not take into consideration the number of edges. For example, a network with nodes A, B, and C has a size of three.

Network Density
Network density is the number of edges divided by the total possible edges. For example, a network with node A connected to node B, and node B connected to node C, the network density is 2/3 because there are two edges out of a possible three.

Path-Level Measures
Path-level measures provide information for a path between one node and another node. Paths follow edges between nodes, known as hops. There are also many different path-level measures, but we’ll look at length and distance.
Length
Length is the number of edges between the starting and ending nodes, known as hops. We must predetermine a path in order to calculate the length between two nodes.
Distance
Distance is the number of edges or hops between the starting and ending nodes following the shortest path. Unlike length, the distance between two nodes uses only the shortest path — the path that requires the least hops.
Connected Components and Bridges
Not all nodes in a network will necessarily be connected to each other. A connected component is a group of nodes that are connected to each other, but not connected to another group of nodes. Another way of thinking of this is a group of connected nodes that have no path to a node from another group. Depending on the network, there can be many connected components, or even only one. The diagram below shows a network with two connected components.

A bridge is a node that when removed, creates a connected component. Another way of thinking about it is that a bridge is a node that is the sole connection of a group of connected nodes to another group of connected nodes.

Hubs and Authorities
Hubs and Authorities are node classifications used in directed networks. A hub is a node that has many edges pointing out of it. You can also think of a hub as a node that’s the starting node of many edges. An authority, on the other hand, is a node that has many edges pointing to it. You can also think of authority as a node that is the ending node of many edges. There’s not a pre-determined number of edges that makes a node a hub or an authority; it will depend on the network. In addition, remember that not all nodes in a directed network will be a hub or an authority.


Dyads and Cliques
Dyads and cliques are pairings of nodes connected by edges. A dyad is a pairing of two nodes, while a clique is a pairing of three or more nodes. While a dyad or clique may be a connected component, they can also be part of a larger connected component.
Implementation
Now that you have an understanding of social network analysis terms and concepts, this guide will walk you through applying these techniques to a data set using Gephi
Download and Install Gephi
First, download and install the Gephi software for the operating system your machine is running. Gephi is available for Mac, PC, and Linux.
Data Set
For this guide, we’ll be using the Marvel Universe Social Network data set from Kaggle. While this data set is already laid out with a node and edge list, when working with data sets not structured as a network this will require some data transformation skills. I recommend using Python and Pandas in these situations.
After downloading the data set, there will be three csv files: nodes, edges, and network. Open the file nodes.csv in Excel.

The nodes file contains a list of all the nodes in the network. This file has two columns: node and type. This network contains two different types of nodes that represent different actor types: heroes and comics.
There is no data preparation needed to import this node list into Gephi, so we’ll close the file.
Next, open the file edges.csv in Excel.

The edges file also contains two columns: hero and comic. Each row in this table represents a single edge. The hero node and comic node are the two nodes connected by the edge.
In Gephi, an edges table requires the column headers of “source” and “target.” In an undirected network it doesn’t matter which node is in which column. However, in a directed network the source column contains the starting node and the target column contains the ending node. Rename column A to “source” and column B to “target.” Then save the file.
Loading Network Data into Gephi
Now that the node and edge lists are properly formatted for Gephi, it is time to load the data.
Open the Gephi software. It should look like this:

Click on new project. If you don’t see the welcome screen, go to file>new project.

Then, click the data laboratory tab.

The data laboratory tab is where we’ll load in our edge and node list files. To import a list click the import spreadsheet button.

Then navigate to the folder containing the data sets and open the nodes file.

An import wizard will then walk you through correctly importing the node list. Set separator to comma, import as to nodes table, and charset as UTF-8. Then click next.

After clicking next, the wizard will provide additional setting configurations. Set time representation to intervals. For imported columns, check the node and type boxes and set their data types to string. Then, click finish.

There is one more step in importing the nodes list. Set graph type to undirected and edges merge strategy to sum. Ensure that it’s set up to append to the existing workspace. Then, click OK.

You should now see some data in the data laboratory window! Next we need to import the edges list.

Now that you’ve imported the data it’s s time to view the graph. Click on the overview tab.

Using Layout Functions
You might be disappointed in the graph that was visualized. It will likely look like the black mess below.

In order to make the graph more readable, we’ll need to use a layout function to change the position of nodes in the graph.

There are a variety of layout functions in Gephi but let’s focus on the ForceAtlas 2 function for now. Select this function and then click run. You’ll see the nodes move in real-time, and you can stop the function when you like the nodes’ position.

After running the layout function your graph should look something like the one below. You can continue to play with other layout functions if you wish to get a better node position. While we’re using the stock ForceAtlas 2 parameters, changing them can give you better control over the node positions. In addition, you can change the parameters of layout functions.

Calculating Network-Level Measures
Now let’s calculate the network size and density of this Marvel network.
The network size is easy to find. In the upper right-hand corner is a pane called context. This window provides the number of nodes and edges in the graph. Because a network’s size is the number of nodes in it, the network size of our Marvel network is 19,090.

To find the network density, we’ll take our first dive into the statistics window. Click on the statistics tab.

This is what you should see:
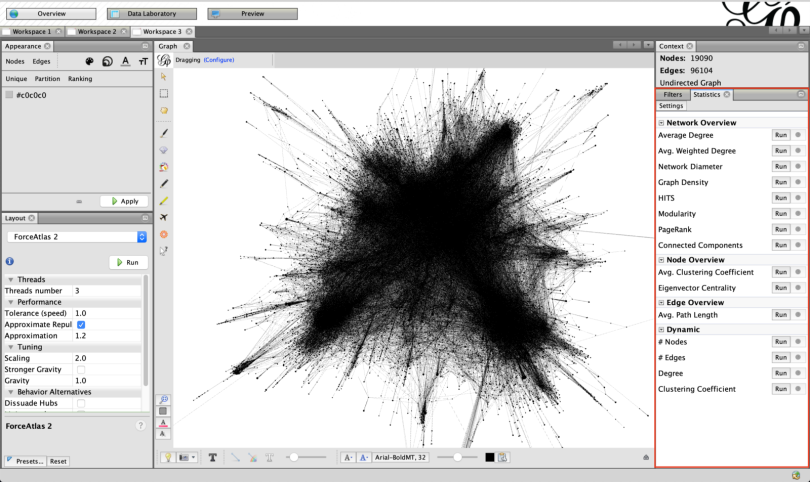
The statistics window contains many measures that can be calculated on the network. To find the network density, click run for graph density.

Select undirected, and then click OK.

A new window will pop up showing the results. This Marvel network has a density of 0.001.

You can save this report by clicking the save button in the bottom left-hand corner, or close it by clicking the close button in the bottom right-hand corner.
Calculating Centrality Measures
Recall that centrality measures are on a node-level, and not a network-level. However, we can also average centrality measures to get a network-level metric. In Gephi, you calculate centrality measures as a network-level average, which then also inputs the centrality measure on a node-level into the data laboratory tab.
Node Degree
To calculate node degree, click run on the average degree algorithm in the statistics window.

The report will provide you with the average degree for the network, as well as a distribution graph. While these can be useful in some applications, we are more interested in the degree on a node-level. Close the report.

To see the degree for each node in the network, go back to the data laboratory window and click on the node table. You will see a new column in the data titled degree.

Node Closeness and Betweenness
Calculating node closeness and betweenness is a similar process as calculating node degree. In the statistics window, click run on the network diameter algorithm.

Select undirected and click OK. Depending on the specs of your machine this may take a little while to calculate.

Like with the node measure, Gephi will provide a network-level report. Click close on this report and go to the data laboratory.

In the data laboratory, you’ll find additional columns in the node table including the node betweenness and closeness.

Calculating Edge Weights
Edge weights are auto-calculated in Gephi. You can find them in the edge list within the data laboratory.

Using Color in Network Graphs
Currently, our graph nodes and edges are black, providing no additional information. You can color-code both nodes and edges in Gephi. The coloring options are in the appearance window.

To color-code the nodes of the graph based on the node degree, click on the nodes button and the color palette button in the appearance window.

There are three options to encode information in the color of nodes: unique, partition and ranking. If you want to change all the graph’s nodes to the same color, use the unique window. Partition will break the nodes into color-coded groups. Ranking will color-code the nodes on a scale.
Let's color the nodes by their degree. To do this, click on the ranking section and select degree.

A color scale will be used to color the nodes. To select a new scale, click on the color selector button to the right of the color scale.

You can select any color scale to use. Then click apply.

As you can see in the above image, coloring our nodes also colored our edges. You can change the color of edges to a specific color using the unique color tab for edges, or apply a ranking or partitioning color scale to them.
Using Size in Network Graphs
You may also notice that the majority of the graph is colored red. This is because most nodes in the graph have a low degree. Zooming in will show that some nodes are yellow or blue.

To make these nodes easier to see in the graph let’s scale the size of the nodes to the node degree as well. To do this click on the nodes and size buttons in the appearance window.

Then, click on ranking and select degree. Change the minimum size to 1 and the maximum size to 100.

Then click apply. We can now better see what nodes have a high degree.

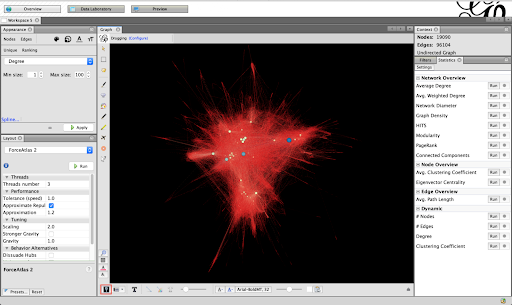
Changing Background Color
Let's also change the background from white to black. Depending on the colors in a graph, either color may look better and it’s often up to personal preference. To change the color to black, press the lightbulb button.
Putting It All Together
This should get you started as you make your first network graph using the Marvel data set and I encourage you to continue playing around with this graph in Gephi. There are many more measures you can calculate and other appearances you can use.
Your next step should be to take another data set and try to reproduce these steps. Eventually, you can try to collect your own data and transform it into a new social network data for analysis.