For most data practitioners, linear regression is the starting point when implementing machine learning, where you learn about foretelling a continuous value for the given independent variables.
Logistic regression is one of the most simple machine learning models. Logistic regression models are straightforward, interpretable and often perform well on classification tasks.
Every practitioner using logistic regression out there needs to know about the log-odds, the main concept behind this ML algorithm.
Is Logistic Regression a Classification Algorithm?
Yes, logistic regression is a classification algorithm.
The log-odds function (or natural logarithm of the odds) is an inverse of the sigmoid/logistic function. The probability outcome of the dependent variable shows that the value of the linear regression expression can vary from negative to positive infinity and yet, after transformation with sigmoid function, the resulting expression for the probability p(x) ranges between 0 and 1.
This is what makes logistic regression a classification algorithm, as it classifies the value of linear regression to a particular class depending upon the decision boundary.
Logistic vs. Linear Regression
Let’s start with the basics: binary classification.
Your model should be able to predict the dependent variable as one of the two probable classes; in other words, 0 or 1.
Linear regression outputs continuous values that cannot be interpreted as class probabilities. For example, if we use linear regression, we can predict the value for the given set of independent variables as input to the model. However, the linear regression model will forecast continuous values like 0.03, +1.2, -0.9, etc., which aren’t suitable for categorizing within one of the two classes nor identifying it as a probability value to predict a class.
For example, when we have to predict if a website is malicious, the response variable has two values: benign and malicious.

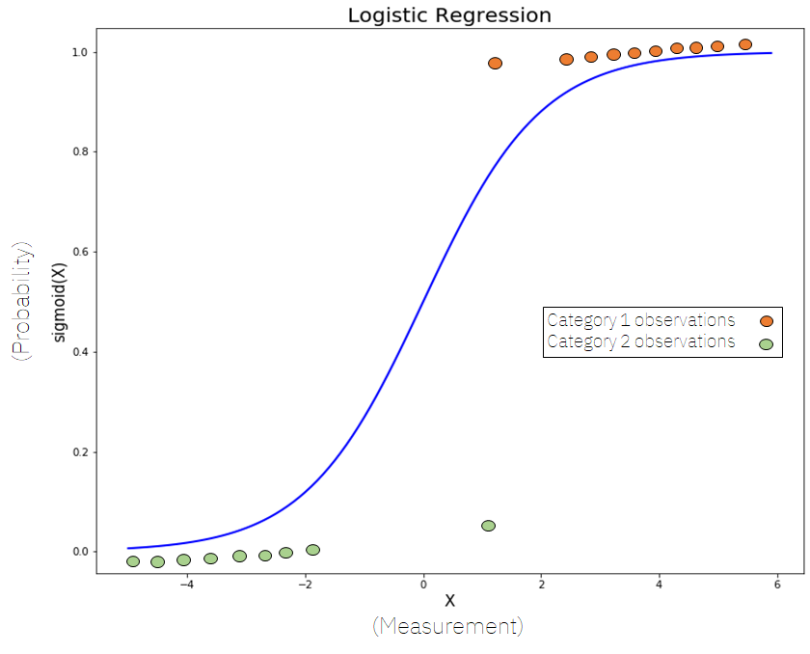
If we try to fit a linear regression model to a binary classification problem, the model fit will be a straight line. Above you can see why a linear regression model isn’t suitable for binary classification.
To overcome this problem, we use a sigmoid function, which tries to fit an exponential curve to the data in order to build a good model.
What Is Logistic/Sigmoid Function?
Logistic regression can be explained with logistic function, also known as sigmoid function, which takes any real input x, and outputs a probability value between 0 and 1, defined as:

Here’s the model fit using the above logistic function:
Further, for any given independent variable t, let’s consider t a linear function in a univariate regression model, where β0 is the intercept and β1 is the slope given by:

The general logistic function p which outputs a value between 0 and 1 will become:

Data separable into two classes can be modeled using a logistic function. The relation between the input variable x and output probability cannot be interpreted easily. We know this because of the sigmoid function so we introduce the logit (log-odds) function, which makes this model interpretable in a linear fashion.
What Is the Logit (Log-Odds) Function?
The log-odds function (also known as the logit function or natural logarithm of the odds) is an inverse of the sigmoid or logistic function.
We can define the log-odds function as:

In the above equation, the terms are as follows:
gis the logit function. The equation forg(p(x))shows the logit is equivalent to linear regression expression.lndenotes the natural logarithm.p(x)is the probability of the dependent variable that falls in one of the two classes,0or1, given some linear combination of the predictors.β0is the intercept from the linear regression equation.β1is the regression coefficient multiplied by some value of the predictor.
On further simplifying the above equation and exponentiating both sides, we can deduce the relationship between the probability and the linear model as:
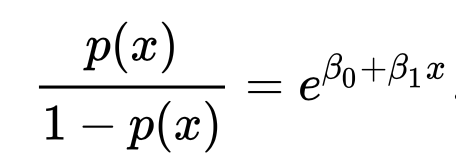
The left term is called odds, which we define as equivalent to the exponential function of the linear regression expression. With ln (log base e) on both sides, we can interpret the relation as linear between the log-odds and the independent variable x.
Why Logistic Regression Is a Classification Algorithm
The change in probability p(x) with change in variable x cannot be directly understood as it is defined by the sigmoid function. But with the above expression, we can interpret that the change in log-odds of variable x is linear concerning a change in variable x itself.
The plot of log-odds with linear equation can be seen as:
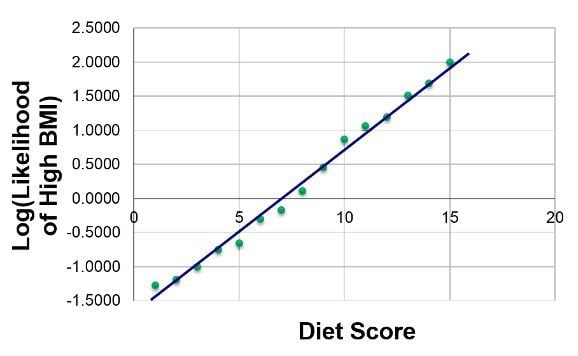
xThe probability outcome of the dependent variable shows that the value of the linear regression expression can vary from negative to positive infinity and yet, after transformation with sigmoid function, the resulting expression for the probability p(x) ranges between 0 and 1 (i.e. 0 < p < 1).
This aspect, plus the use of a threshold (decision boundary) on the probability output to assign class labels, is what makes logistic regression a classification algorithm. It transforms the continuous output of a linear model into a classification.
What Is Decision Boundary?
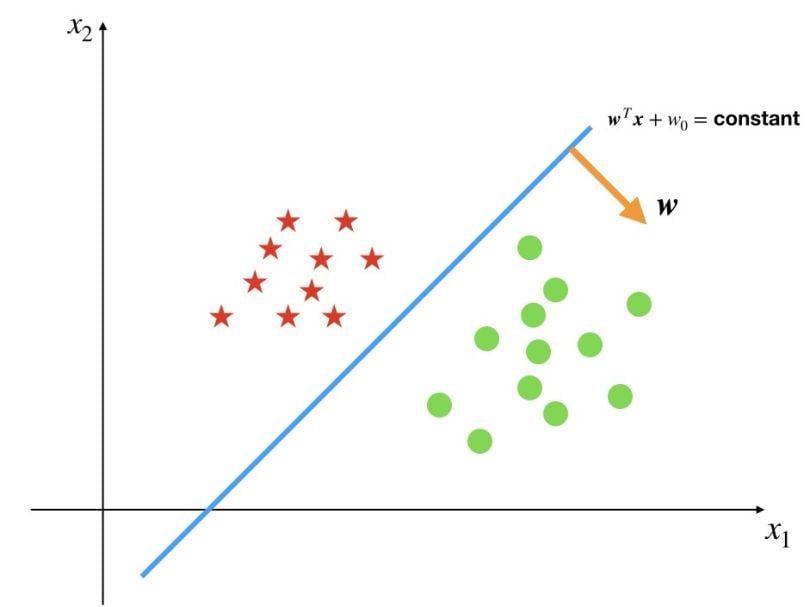
The decision boundary is defined as a threshold value that helps us to classify the predicted probability value given by sigmoid function into a particular class, whether positive or negative.
Linear Decision Boundary
When two or more classes can be linearly separable:
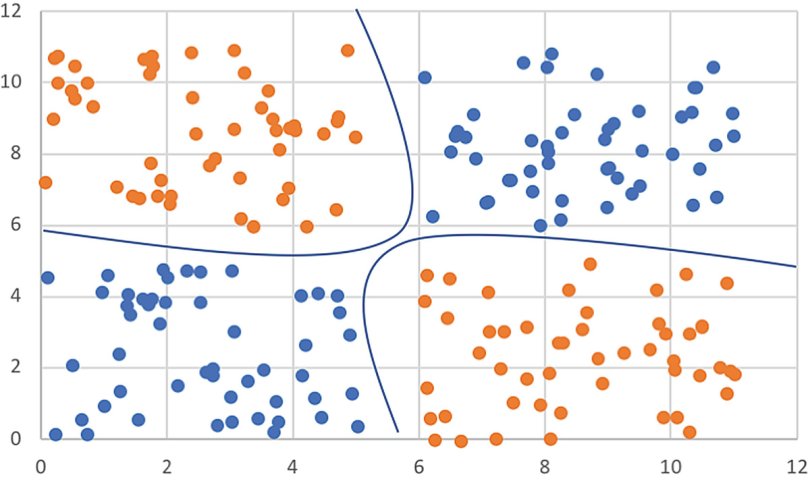
Non-Linear Boundary
When two or more classes are not linearly separable:
Multi-Class Classification vs. Binary Logistic Regression
The basic idea behind multi-class and binary logistic regression is the same. However, for a multi-class classification problem, we follow a one-vs-all classification. If there are multiple independent variables for the model, the traditional equation is modified as:

Here, we can define the log-odds as linearly related to multiple independent variables present when the linear regression becomes multiple regression with m explanators.
For example, if we have to predict whether the weather is sunny, rainy or windy, we are dealing with a multi-class problem. We turn this problem into three binary classification problems. Is it sunny (yes or no)? Is it rainy (yes or no)? Is it windy (yes or no)? We run all three classifications independently on input features and the classification for which the value of probability is the maximum relative to others becomes the solution.
Frequently Asked Questions
What makes logistic regression a classification algorithm?
Logistic regression transforms the output of a linear equation into a probability using the sigmoid function, then applies a decision boundary to assign a class label — making it a classification algorithm.
How does logistic regression differ from linear regression?
Logistic regression predicts probabilities that are mapped to discrete classes using a threshold, while linear regression predicts continuous values.


