

Would you say your pain level reading this blog post is:
- One to three: a minor annoyance, at worst
- Four to six: a real pain to get through
- Seven to 10: a public nuisance on the order of roaches or rats?
The above question and those like it — repeated ad infinitum in doctor’s offices, Gallup polls and employee exit interviews — exemplify a data type commonly referred to as “ordinal” data.
Ordinal Data vs. Nominal Data: What’s the Difference?
- Ordinal data is data that can be ranked or ordered. Examples include data taken from a poll or survey.
- Nominal data is data that can be made to fit various categories. Examples include whether an animal is a mammal, fish, reptile, amphibian, or bird.
What Is Ordinal Data?
Ordinal data is qualitative data that is ordered or ranked. This data has a natural hierarchy, where the distance between categories is unknown. Ordinal data variables are non-numerical, similar to nominal data.
What Is Nominal Data?
Nominal data is a type of qualitative data categorized into distinct groups, without any numerical value or inherent order. Unlike other data types, it is not ranked or structured hierarchically, making it unsuitable for mathematical operations. Nominal data is the most basic level of data measurement in statistical analysis, and is used to label and classify non-numerical variables.
To flesh this out a bit more, we’ll turn to Stanley Smith Stevens and the Level of Measurement scale he pioneered.
Levels of Data Measurement
In a 1946 article in Science magazine, psychologist Stanley Stevens laid out a hierarchy of the four main types of data researchers collect — nominal, ordinal, interval and ratio. Stevens based his evaluation of each level based on its measurement precision. Here’s the differences between each level of measurement and how ordinal data fits into the scale.
Nominal Data
Nominal data is a qualitative type of data used to classify and label variables, and is known as the simplest data type on Stevens’ scale. All nominal data is categorical (meaning this data can be sorted into groups). It has no specific order or hierarchy, and has no numerical value. Variables like name, color and zip code are examples of nominal data.
Ordinal Data
Ordinal data is a qualitative data type that classifies variables in a ranked order. This kind of data is categorical and separates variables into groups based on distinct ascending or descending hierarchies. Ordinal data encompasses variables like educational level, economic status or level of customer satisfaction.
Interval Data
Interval data is a quantitative type of data that classifies variables in a ranked order on a scale, with equal distances (intervals) between each variable. Data in the interval level of measurement is numerical, meaning it comes in the form of numbers. Temperature in degrees, grouped income ranges and SAT scores are examples of interval data.
Ratio Data
Ratio data is a quantitative, numerical data type that is similar to interval data, except it recognizes the concept of true zero. In a ratio scale, the value of “0” cannot be measured because “0” — in a true zero sense — represents nothing (or the absence of a variable). This also means ratio data cannot include negative values, as there is no numerical zero to pass on the scale. Ratio data can involve measurements of height, weight or the number of people on a team.
Ordinal vs. Nominal Data
When looking at Stevens’ four levels of measurement, nominal data lies at one extreme of the scale. To collect this information, researchers simply had to classify something into a pre-defined category. Categories showed no order apart from membership based on some criteria. Political affiliation (such as being a Democrat, Republican, or independent voter) and animal classifications (like fish, bird, mammal, reptile, amphibian, or insect) are both examples of nominal data.
On the other extreme of Stevens’ scale lies ratio data, which has a true zero, equal spacing between units of observation and a scale applicable to every observation that extends from small to large. Temperature in kelvins, income, years of life, and speed are examples of ratio-scale data.
Ordinal data falls between these two extremes. Unlike its nominal cousin, ordinal categories have a rank structure. On the other hand, unlike its ratio-scale cousin, distances between ordinal ranks do not need to be equal or even standardized between rank levels.
What Is an Example of Ordinal Data?
To further illustrate the difference, consider ways of assigning ranks to students in a classroom. One teacher (presumably a tall one) wants to rank students by their heights. The scale of measurement, whether it be in inches, feet, meters, or some other, is the same for each student and equally calibrated so that measurements are directly comparable.
Another teacher (presumably a cheery one) wants to rank students by happiness. Some students surely are happier than others. But there is no standardized scale by which to measure student happiness. In lieu of a standardized, calibrated measurement, teachers must either rely on student self-reporting via a survey instrument or they must rely on external observers to judge student happiness based on some common criteria, i.e. a rubric or form. The challenge inherent in this is that the distance between one student’s being “happy” and “very happy” can be radically different from another student’s. This problem persists despite how the data are collected.
Ordinal scales beget different types of statistical inferences than do more precisely measured data. Ordinal data also makes predictive inference more challenging. But it’s not impossible. If enough ranked data can be collected in the same way, then researchers can construct empirical distributions of the frequencies of individuals’ rankings. This allows researchers to examine summary statistics like medians and interquartile ranges in ordinal-scale data. All of this flows from the natural rank structure of the ordinal scale, even though distances between ranks can differ between individuals. The simple fact that units are orderable, even though the orderings will be different from person to person, provides enough structure in the data to allow researchers to employ a range of empirical methodologies for getting at statistical regularities.
How Is Ordinal Data Used?
Because ordered data are categorized along a continuum, they can be assigned numerical likelihoods. If researchers can justifiably make distributional assumptions about these likelihoods, then they can compute probabilistic estimates of ordinal outcomes. This is especially powerful because it allows researchers to use information contained in precisely measured predictors to estimate how likely ordinal outcomes will be. To see why, let’s go back to the classroom-ranks conundrum.
If there is reason to suspect that taller people tend to be happier, student height measurements can provide a basis for probabilistic inference about how happy students are. For instance, if a student is 1.5 times taller than the class’s average height, the frequency of happiness levels reported allows teachers to claim that student is twice as likely to be “very happy” relative to other students, four times as likely to be “happy” or “very happy” relative to other students, and so on.
By exploiting the linkage between the rank-ordering of student happiness levels and student height, teachers can use movements on the height scale, which is more measurable, to decipher movements along the not-directly-measurable (or, switching back to academese, “latent”) student-happiness scale. As long as correlation exists between predictors and an ordinal outcome and researchers are willing to make assumptions (and justify them) about what distribution the ordinal outcomes likely exhibit, they can probabilistically predict ordinal outcomes.
How Is Ordinal Data Collected?
Ordinal data is often collected through surveys, questionnaires and observational studies, where respondents rate or rank their preferences, satisfaction levels or experiences on a scale (“strongly agree” to “strongly disagree”, for example). While the order matters, the precise differences between the ranks are not measured or uniform.
The biggest pitfall to estimating ordinal outcomes is measurement error arising from data collection. Ordinal data collection suffers more than nominal data from measurement error because nominal data are simpler to collect. Only categorizing items is more straightforward than both classifying and ranking items. For instance, identifying car makes as Porsche, Ford, BMW, or Subaru is easier than attempting to rank-order them based on consumer preference.
Unlike ratio data, ordinal data also suffers from imprecision due to a lack of a standardized, equally spaced continuum of measurement. Thus, direct comparison is not on offer with respect to ordinal outcomes.
For these reasons, researchers must avoid measurement error when collecting ranked outcome data. Methods for doing so include standardizing both questions on surveys and how people can respond to them. Changing categories, vague cut points, or murky wording can make for erratic, noise-filled responses.
The likelihood of measurement errors also increases when data is collected by second- or third-parties. Errors can come from surveyors, respondents or disparate observers who record totally different outcomes for the same scenario. And the absence of a universal scale of measurements complicates predictive inferences and statistical estimations. Assumptions play a greater role in statistically examining ordinal outcomes, and unwarranted, unstated, or unrealized assumptions made by researchers can undermine the reliability of their findings.
What Is Ordinal Data Used For?
Ordinal data, when well and consistently collected, allows researchers to bring statistical insight to bear on a variety of topics not broachable by more precise forms of scientific measurement. Important questions concerning overall contentment in life, subjective interpretations of job or family satisfaction, individual feelings of pain or depression, and many others can all be addressed on a large scale using ordinal outcomes. Understanding ranked information and subsequently using it to build accurate statistical models, to the extent researchers can, opens the door to a deeper understanding of subjective but common human well-being.
Nominal and Ordinal Data in Machine Learning
When it comes to machine learning, nominal and ordinal data are both used widely. Because computers cannot inherently discern the differences between data types, developers must translate these categories into numerical formats — a step called encoding— that tells an algorithm to interpret to find relationships between variables. However, they must be properly labeled to prevent the model from making logical errors.
Once encoded, ordinal data can be used to capture progesterone, for example. Or it can be used in machine learning algorithms for credit scoring and risk assessment. Meanwhile, nominal data is used as the target variable that tells the model the outcome trying to make a prediction. This data is used in processes like email filtering to decide if a message is spam or not spam, or in computer vision to classify different images.
Frequently Asked Questions
What is the difference between ordinal data and nominal data?
Ordinal data is qualitative data that is categorized in a specific ranked order or hierarchy.
Nominal data is qualitative data that is categorized based only on descriptive characteristics. This kind of data has no ranked order or hierarchy.
What is an example of ordinal data?
Education level, economic status and level of customer satisfaction are examples of ordinal data.
What is the difference between ordinal and interval data?
Ordinal data is qualitative and grouped in a ranked order, but it lacks numerical value and known intervals between values.
Interval data, on the other hand, is quantitative, ranked and has equal, known intervals between values.
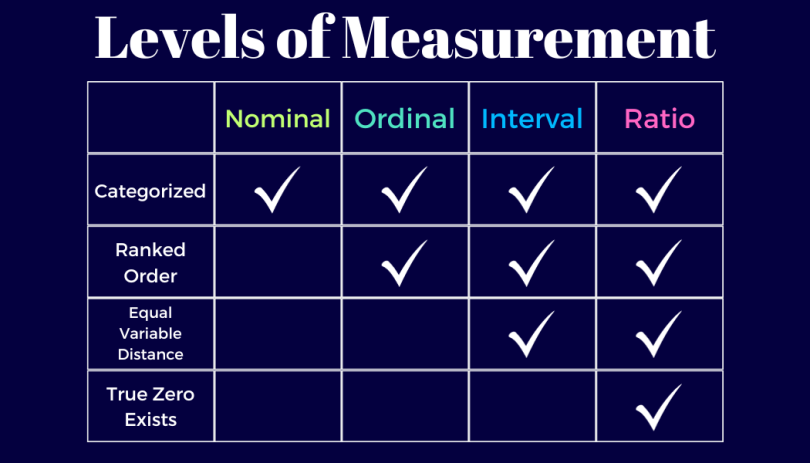
How do I know if my data is nominal, ordinal, interval, or ratio?
To know if data is nominal, ordinal, interval or ratio, here are the differences between them:
- Nominal data: can only be categorized.
- Ordinal data: can be categorized and ranked.
- Interval data: can be categorized, ranked and has equal distance between values.
- Ratio data: can be categorized, ranked, has equal distance between values and has true zero.
What are nominal vs. ordinal data examples?
Nominal data is used for classification. These categories do not have a “higher” or “lower” values. Examples include
- Biological Species: Mammal, bird, reptile, etc.
- Employment Status: Employed, unemployed, retired, etc.
- Eye Color: Blue, green, brown, etc.
- Geographic Location: Zip codes, city names, country of origin, etc.
Ordinal data represents categories with a natural order or rank. However, the “distance” between these ranks is not mathematically equal or defined.
- Survey Responses: “Very Dissatisfied,” “Neutral,” “Very Satisfied,” etc.
- Economic Status: Low-income, middle-income, high-income, etc.
- Education Level: High school, undergraduate, graduate, etc.
- Pain Scales: Ranking pain from a scale of 1 to 10


