?")
The Unified Modeling Language (UML), often described as the blueprint for software, is a standard design language developed to provide a common, universal format for visualizing, constructing and documenting computer applications. At its core, UML is an integrated set of diagrams used to model systems, from software architecture to general business processes. It works by employing its own syntax of symbols, shapes and connection rules, allowing developers, architects and business analysts to clearly communicate the static structure and dynamic behavior of a system before a single line of code is written.
What Is the Unified Modeling Language (UML)?
UML is a universal visual language for designing and documenting software systems and business processes. It uses an integrated set of 14 diagrams, split into structural (for system construction) and behavioral (for system interactions) types. It functions as a blueprint, using symbols, shapes, and connection rules to model elements like classes and relationships.
Purpose of the Unified Modeling Language
The Unified Modeling Language, more colloquially known as UML, was created originally to provide a common design language and universal format that could be used when developing and building computer applications. At its core, it consists of an integrated set of diagrams, which are used as the building blocks for visualizing, constructing and documenting software systems. Beyond this, you can also use UML to support more general business modeling as well as other non-software systems.
How Does the Unified Modeling Language Work?
Oftentimes, you’ll hear the analogy that building software needs to follow a regimented process similar to building a house. You can extend that analogy a bit further and think of UML as the blueprint that represents a software system.
Since UML is a modeling language, it’s more general purpose and isn’t a programming language. It does, however, have its own syntax that consists of symbols, shapes and connection rules for various elements like classes, objects and relationships.
Once these elements are arranged into standardized formats or diagrams, they serve as the framework or blueprint for all sorts of business processes, including software development. It is important to note that UML is composed of many distinct diagram types. Each type serves a specific purpose and emphasizes a specific aspect of a system’s behavior or design. Broadly, UML diagrams are categorized into either structural or behavioral types.
Structural UML Diagrams
First, we’ll take a look at some common structural UML diagram types.
Class Diagram
The main building blocks of an object oriented system that depict a view of the model by describing what attributes and behaviors it has. They typically highlight relationships between classes and interfaces.
Component Diagram
A visual illustration of how independently deployable parts and/or various pieces of software make up a system. They are often used when wanting to show the relationships between microservices.
Composite Structure Diagram
A type of diagram that is best suited for showing the internal structure of a class and how its parts interact to fulfill behaviors.
Deployment Diagram
A model of the run-time architecture of a system that shows how software is deployed to hardware nodes. The main aspects include Nodes, Artifacts, and the Connections (or Associations) between them
Object Diagram
A diagram that is often considered to be a special type of class diagram since it describes the structure of a system at a particular moment in time. They can be particularly helpful in explaining test scenarios or debugging a runtime error.
Package Diagram
A way to group related elements in a system (often in the same namespace) such as classes, interfaces and components into packages. They help to organize system elements into related groups to minimize dependencies between packages.
Profile Diagram
A diagram that serves to extend any UML diagram by allowing the addition of user-defined constraints, stereotypes, tagged values or extensions. These modifications serve to adapt the core UML structure for specific platforms or verticals.
Behavioral UML Diagrams
Now let’s look at some behavioral diagrams.
Activity Diagram
A visual representation of the sequences of activities or user workflows that are possible within a system. They are frequently used for business process modeling. The activities mapped can be concurrent or sequential, but there will always be a defined beginning and end.
Communication Diagram
Formerly known as a collaboration diagram, these model how objects interact with each other and the order of messages exchanged. They emphasize the relationships between objects over a period of time.
Interaction Overview Diagram
Often considered to be a combination of activity and sequence diagrams. These model a series of actions and allow for the deconstruction of complex interactions since each individual activity has its own frame that can have nested interactions.
Sequence Diagram
A close relative to the communication diagram, which shows the sequence of messages passed between objects over a (vertical) timeline. They show behavior and system logic, so these are widely used for scenarios like user flows (ex: placing an order) or API calls.
State Diagram
Also known as a state machine diagram, these describe all the ways classes can dynamically respond to an external event or stimulus. Typically they will show all the states an object might undergo during its lifetime.
Timing Diagram
Sometimes considered to be a fusion of sequence and state diagrams, with a strict focus on time. They focus on mapping how long each state lasts (along an x-axis) and when transitions or interactions happen.
Use Case Diagram
A dynamic diagram that models the functionality of a system using actors and use cases. They show the sequence of steps that a user (actor) takes to achieve a specific goal.
UML Basic Notations
UML consists of several graphical constructs that make up the core of its notation. All of the UML notations are meant to be drawn on a two-dimensional surface. Though some of the shapes (e.g., cubes) are three-dimensional shapes, in UML, they’re rendered as icons on a two-dimensional surface. The four main constructs that make up UML notation are icons, two-dimensional symbols, paths and strings.
1. Icons
An icon is a small, graphic symbol of a fixed shape and size that represents an application, a concept, a capability, et cetera. It will never expand to hold content. Rather, icons often appear within area symbols, as terminators on paths or as standalone symbols that may not be connected to paths.
2. Two-Dimensional Symbols
Unlike an icon, a two-dimensional symbol is dynamic and does not have a fixed size since they often expand to hold content like other symbols or a list of strings. They’re frequently divided into compartments and can be connected to other symbols via paths. Since paths are typically connected to a two-dimensional symbol via a termination, moving or removing a symbol can affect the contents and/or paths associated with it.
3. Paths
According to UML, paths are sequences of line segments whose endpoints are attached. A path is a single entity, but the segments can be adjusted. This means a path can have angles to accommodate other symbols in the diagram. As a result, a segment doesn’t exist on its own without a path. And a path is always attached to other symbols on both ends or will end in a terminator. This ensures that lines will never be floating or dangling.
4. Strings
Strings are used in UML to display information in an “unparsed” form, so the characters have not been processed by a system or formatted into a specific syntax. Once the string is used in a model, it can be parsed via the appropriate syntax.
For example, there are specific syntaxes that exist for attributes, operations, and transitions. Strings may exist in many formats: as a singular element of symbols or compartments of symbols, as elements in lists, as labels attached to symbols or paths or as stand-alone elements on a diagram.
UML Diagrams Structure
Each of the 14 types of UML diagrams has their own unique purpose and structure. As noted above, the diagrams are split into two different categories: structural and behavioral diagrams. A structural diagram’s purpose is fairly self-explanatory: They show how a system is constructed. This includes all the elements of the system such as classes, objects or components and how they all connect.
A behavioral diagram’s purpose is to show all the interactions a system has. Those interactions might be with other systems, end users, itself (recursive) or a combination of several of these.
Let’s do a deep dive into a few of the most popular and commonly used diagrams. The top three are class diagrams (structural), sequence diagrams (behavioral), and use-case diagrams (behavioral). We’re going to go through class and use case diagrams in depth.
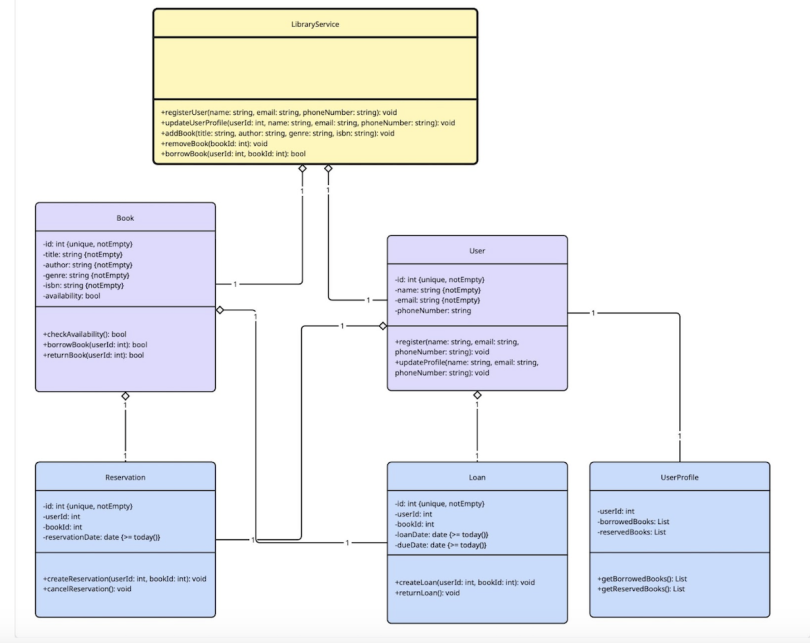
Class Diagrams
Class diagrams are one of the most popular UML diagrams since they’re the foundation of almost every object-oriented method. They depict a model’s static view and describe its attributes and behaviors. They also highlight the relationships between classes and interfaces. Other key features that are highlighted in these diagrams include associations, dependencies, generalizations, et cetera.
Classes
A class is a data type made up of attributes and methods. They’re illustrated as rectangles divided into compartments. The top section contains the name of the class, centered and capitalized. The second section contains the attributes, and the bottom section holds the methods.
Active Classes
An active class is designated by having a thicker border and initiates or controls the flow of activity. A passive class serves other classes and/or stores data.
Associations
An association represents a static relationship between classes. A filled arrow is typically used to indicate the direction of the relationship, and the association name goes on, above or below the arrow line. Any roles are placed near the end of an association.
Multiplicity (Cardinality)
This is notation that is placed near the end of an association to indicate the number of instances of one class linked to another. For example, a school will have many students, but a student will only attend one school.
Constraint(s)
This is a boolean condition that serves as a restriction on a model element; typically placed inside curly braces: {}.
Composition and Aggregation
An aggregation shows a class that’s made up of smaller components or classes. These are illustrated with a hollow diamond, and the target class typically plays a more important role.
A composition is a stronger form of aggregation illustrated by a solid diamond, and components are included in a maximum of one composition at a time. Typically, if a parent of a composition is deleted, all the associated parts are as well. For example, if you have a class House and a class Room, a composite aggregation exists there. If the house is destroyed, so are the rooms.
Generalization
Generalizations show inheritance. Essentially, this is a visual way to show that one class is a specialized version of another, meaning that the source inherits the target’s characteristics. For example, a cat is a type of mammal. So the class Cat would have a generalized relationship with the class Mammal.
Visibility
Visibility markers are used to indicate who is able to access information contained within a class. A public operation, indicated with a plus sign, allows other classes to view the information. A private operation, indicated with a minus sign, prevents information from being viewed outside the class partition. A protected operation, indicated with a hashtag, allows child classes to access information that has been inherited.
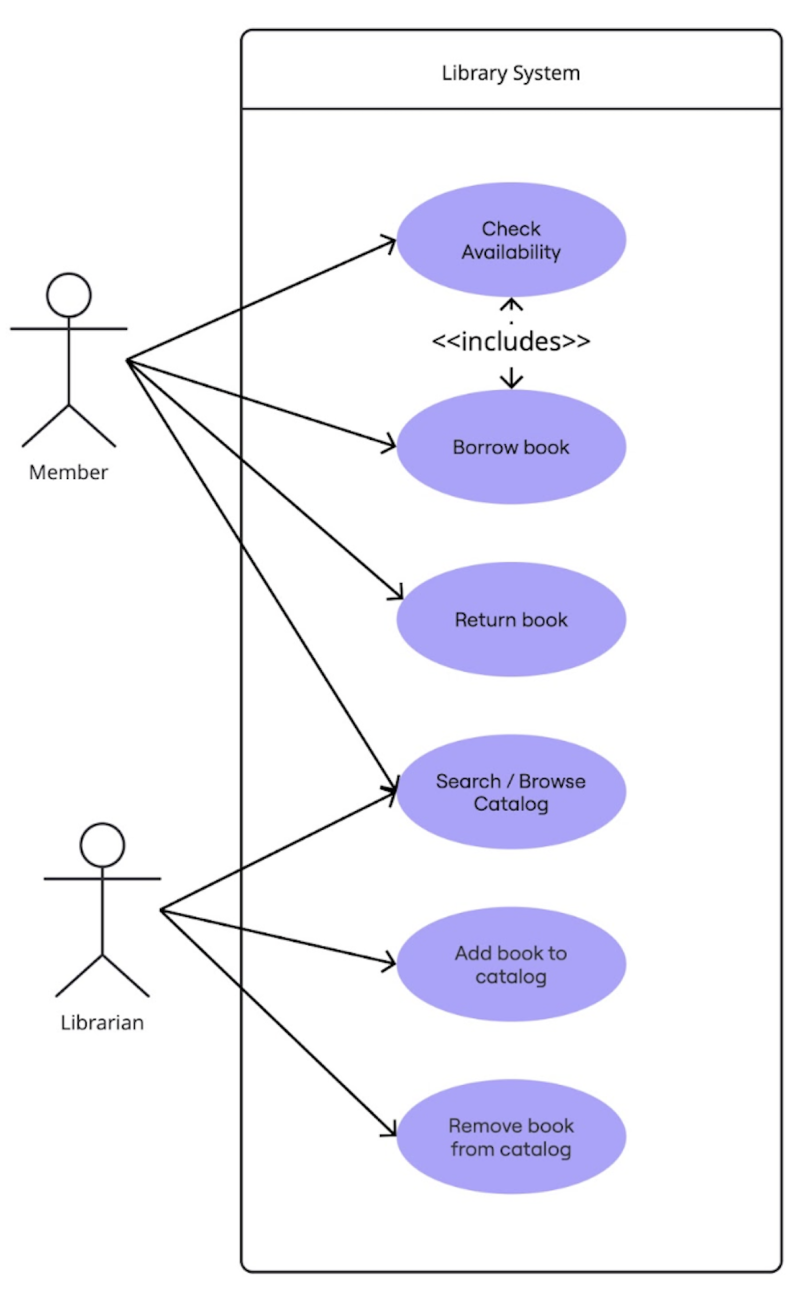
Use Case Diagrams
Use case diagrams are another one of the most popular UML diagrams since they model user flows and the key functioning parts of a system based on use cases and actors. The main symbols and notations in these diagrams are systems, use cases, actors and relationships.
System
A system is an entity that’s used or operated like a piece of hardware or a software product. It’s drawn as a rectangle with use cases contained within it and actors outside the scope of it.
Use Case
A use case describes the scenario(s) for how a user interacts with the system. It can be simple with minimal steps or complex with a full list of actions or steps. It can be drawn using an oval with a label to represent the system’s purpose.
Actors
An actor is someone who uses a system. There are instances where a system can be an actor of another system. When that occurs, label the actor system with the actor symbol.
Relationships
A relationship can exist between a use case and an actor and will be drawn as a simple line with an arrow. There are two options for the labels for these: “extends” or “includes” (previously known as “uses”). An extend relationship shows an optional or conditional behavior that can be added onto a base use case. Certain conditions must be met in order for this to execute.
An example of this might be “Add a tip” to a “Order coffee” use case. An include relationship is mandatory and is a necessary part of the base use case. Using that same coffee scenario, a “Make payment” would be included in an “Order coffee” use case.
Behavior Interaction
The other main type of diagram in UML is behavioral. Within that category, there is a subset of diagrams known as behavioral interaction diagrams, which are used to model the dynamic aspects of a system. Within the subset of interaction diagrams, the two primary types are sequence diagrams and communication diagrams. The other two, less frequently used, interaction diagrams are interaction overview diagrams and timing diagrams.
UML behavioral interaction involves showing the exchanges of messages between various elements or components to accomplish a specific process that is often time-dependent. Essentially, they are providing a visual representation for how actors or objects communicate to complete the steps in a use case and thus show an interaction.
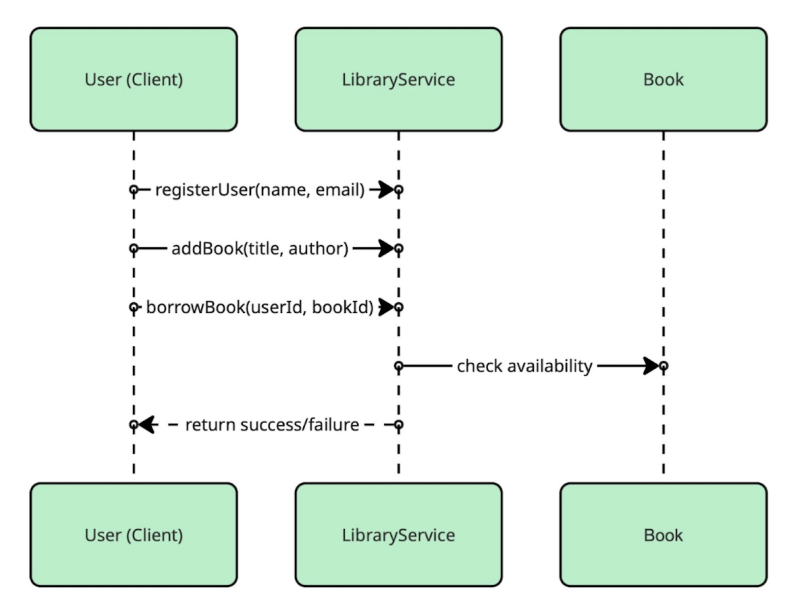
All the different types of communication that occur in an interaction diagram are known as messages. The messages are sent back and forth between instances of classes or actors. A class is designated as a box with a class and object identifiers, the same as in a class diagram) Actors are shown using the same stick person symbol from the previous use case diagram example. The messages are displayed as arrows from actor to object(s) or between two objects. In order to define the interaction, one needs to first know the actors and objects, so it is often best practice to already have a class diagram and use case diagram prior to building out an interaction one.
A sequence diagram shows the sequence of messages sent between objects or actors while performing a task. The objects involved are displayed from left to right and often are initiated by an actor at the top left. The top is considered the starting point and time is expressed vertically, so you will see boxes extending toward the bottom. Here is an example using the previous class diagram for a library service.
A communication diagram shows how objects work together and is very similar to both an object diagram and a sequence diagram. However, it is simpler than both of those since it just shows communication links between objects and the messages themselves are attached to the links. The message is represented with an arrow and labelled with the message name along with any optional arguments. The order of the messages is shown by including a number prefix.
Since communication and sequence diagrams are very similar, it can be difficult to determine which one to use. Sequence diagrams are often the better choice if you need to easily see the order the messages happen, you need to show the specifics of the messages (ex: the parameters), you need to show loops or optional flows, or you want to build upon an existing use case. A communication diagram is ideal if you need a simpler alternative to a sequence diagram that emphasizes links between objects without the time ordering or if you need to focus on structure.
Applications of Unified Modeling Language
One of the most frequently used applications of UML is building web applications. UML can effectively diagram back-end architecture and model user interfaces. Additionally, it works well for mapping out changes to an existing system without having to fully build out the infrastructure. It can also be used with planning and prioritization.
For the former, creating diagrams such as a Sequence or an Activity one, can depict the full scope of a business process as well as where other systems slot in, which can help highlight any limitations, updates that might be needed, or new flows that need to be created. For the latter, diagrams such as a Use Case one, can be leveraged to identify all the user stories that need to be addressed by a system or process and once that information is known, prioritization can take place for what order to address.
Another common use case for UML is for modeling, designing and documenting the various aspects of embedded systems. The more complex something becomes, the more useful it is to have a way to map out all the connections. Since embedded systems need to balance hardware constraints with software requirements, UML can help engineers working on them design and communicate with ease. Separate teams often handle hardware and software, so having a standard of communication is key. UML can really shine in bridging that gap.
That being said, UML is no longer exclusively used in the software industry. You can often find them in other areas of business. For example, business analysts often find them particularly useful in visualizing a system or process that needs an efficiency boost.
In addition, businesses also use UML diagrams to provide clarity. Sometimes that might be between systems and processes, but other times that might mean defining which department handles specific tasks or activities. Last, UML can even document systems like customer service escalation processes to ensure shared understanding.
History of Unified Modeling Language
The Unified Modeling Language Reference states that “UML was developed in an effort to simplify and consolidate the large number of object-oriented (OO) development methods that had emerged.” With the appearance of the first object-oriented language, Simula-67, in 1967, many other developers were inspired to create other object-oriented languages.
As a result, by the mid-70s, various other OO languages started to become prevalent. Modeling languages were also created alongside them, and the field of object-oriented methodology was born. Each modeling language was unique with its own notation, rules and semantics, however. This variance led to many disagreements over superiority, an inability to exchange models between methodologies and even a period of so-called “method wars” since nobody could agree on a single approach.
Despite attempts made to standardize, the first real progress began to be made when James Rumbaugh, the creator of object-modeling technique (OMT), left his job at General Electric to join Grady Booch, the creator of the Booch Method, at Rational Software. The two started to collaborate and combine concepts from their respective methods, and they came to an initial joint proposal in 1995.
That same year, Ivar Jacobson, who had developed object-oriented software engineering (OOSE) also joined the team at Rational. All three, known colloquially as “The Three Amigos,” combined forces. From their joint work, the Unified Modeling Language (UML) was born.
The collaboration of the authors of three top methods was a watershed moment that led to the Object Management Group (OMG) issuing a request for proposals the following year for a standard approach to object-oriented modeling. The OMG had only been founded a few short years prior in 1989 but was already a heavyweight in setting computer industry standards. The three authors of UML began to work with other methodologists, and they created and submitted a final UML proposal to the OMG in September 1997. This proposal was endorsed by the OMG on November 17, 1997, and UML 1.1 became the official standard.
The first release of UML consisted of nine diagram formats, and a task force was formed to address future iterations. There were several minor versions released, 1.3, 1.4, and 1.5, but there wasn’t a major version bump until 2005 with 2.0. With UML 2.0, the number of diagrams increased from nine to 13. There have been several minor version releases for UML 2, and each has introduced changes. One of the UML extension mechanisms, the Profile Diagram, included in 2.x ended up gaining traction and that was officially added as the fourteenth diagram format with UML 2.5. The current version of UML is 2.5.1, which was published in December 2017. It continues to be reviewed and improved by the task force to this day.
Frequently Asked Questions
What is unified modeling language used for?
UML is used most typically in a professional environment where system design and documentation are important. In software development, a variety of different roles such as software developers, system/solution architects and database architects use it.
Developers find it to be highly effective when it comes to understanding requirements, formulating architecture and communicating the behavior of a system. Similarly, architects use it to be able to map out a high-level view of a system’s interactions or to show all the relationships and constraints between tables if building a database.
Other fields besides software engineering frequently use UML, however. Some other roles that often create diagrams include product managers, technical writers, quality assurance engineers and business analysts. For business analysts and product managers, UML is useful for modeling business processes and requirements as well as tracking system components. Technical writers and quality assurance engineers are more likely to create diagrams that serve as user guides or map out test cases and user flows. Regardless of the industry or role using UML, the diagrams created can be understood and digested by both technical and non-technical stakeholders and thus often are used in planning or department meetings.
What are the main types of UML diagrams?
Per the standards set out in the current official version of UML, 2.5.1, there are 14 distinct diagram types that fall into one of two groups: structural diagrams and behavioral diagrams.
Structural UML diagrams
- Class Diagram
- Component Diagram
- Composite Structure Diagram
- Deployment Diagram
- Object Diagram
- Package Diagram
- Profile Diagram
Behavioral UML diagrams
- Activity Diagram
- Communication Diagram
- Interaction Overview Diagram
- Sequence Diagram
- State (Machine) Diagram
- Timing Diagram
- Use Case Diagram
How is UML different from flowcharts?
At their cores, UML and flowcharts are both tools for visualizing and communicating in software and systems, but they serve different purposes with varying levels of complexity. Typically, a flowchart’s scope is specific to a single process or function, whereas UML is often used to map out a whole system’s structure and interactions. In addition, many different types of UML diagrams exist, but a flowchart is a type of UML Activity Diagram. Finally, UML has global standards, whereas a flowchart is super flexible and doesn’t require following any specifications.