Software development rarely happens in isolation. Developers have to work with other developers, designers, project managers and customers to create products everyone is satisfied with.
With so many stakeholders, it’s easy to miscommunicate — and in a field where small details matter, communication is important for keeping projects on track. Even developers sometimes find themselves in long technical conversations, only to realize later that they weren’t really describing the same thing at all. UML diagrams can help make communication more clear.
What Is a UML Diagram?
The Unified Modeling Language is a diagramming standard created for the software development field. The style is maintained by the Object Management Group, and is an approved International Organization for Standardization diagram language. Following a standard for diagramming eliminates miscommunication over different people’s diagramming styles.
UML Definition
Although some might think time spent learning to draw diagrams is time wasted, the skill can pay off in big ways. Diagrams focus conversations and facilitate communication, and they can cut down on time that would be wasted on explaining and re-explaining.
“Rather than writing a 200-page document, you can draw a few diagrams to show how it works together,” said Chandika Jayasundara, CEO of Creately, a company that helps customers template and design diagrams.
Explaining what all the different shapes on a diagram mean to a new audience could take some time. Standards like UML only require that everyone learn one standard, rather than adapting to each diagrammer’s individual style each time.
Types of UML Diagrams
UML diagrams can be sorted into two categories: structural and behavioral. Structural diagrams map out the components of a system, while behavioral diagrams describe how those components interact together.
Jayasundara used a bicycle analogy to describe the difference between the two. Structural diagrams would include all the bicycle’s physical hardware: the frame, the pedals, the handlebar and even the bicycle’s name brand.
“The behavior would be when you start pedaling, it will move forward,” he said. “When you turn the handle, it will turn. So that would be how the system behaves together.”
There are a total of 14 diagrams in the UML standard. Below are a handful of the go-to diagrams that people use most often.
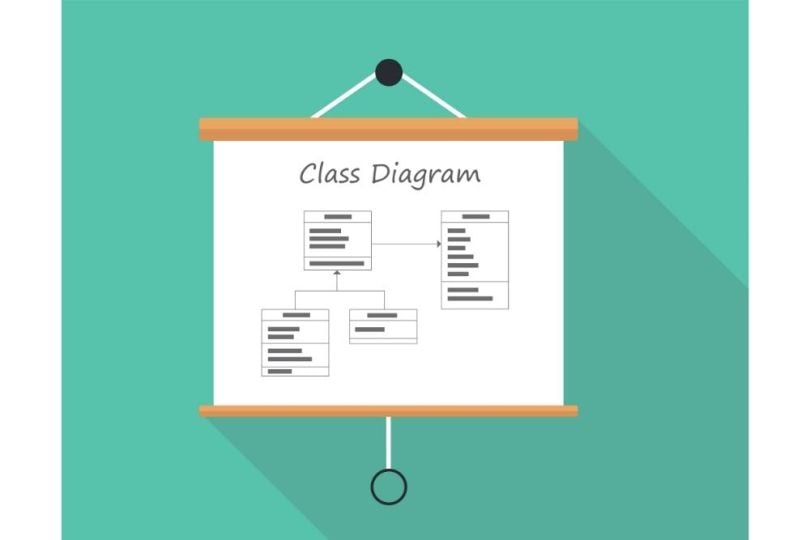
Class Diagram
The most common structural diagram is the class diagram, which documents the variables belonging to object-oriented classes and the relationships between classes. Class diagrams operate on a low-level code basis, and are good for technical audiences.
J.D. Baker, a member of OMG’s architecture board and board of directors, said class diagrams can also be used when planning domain-driven design.
“We could use the classes to describe the problem domain, and that works in a number of other methodologies as well,” Baker said. “So the classes have different abstractions, depending on where you’re using them — whether it’s in the analysis stage or it’s in your design stage.”
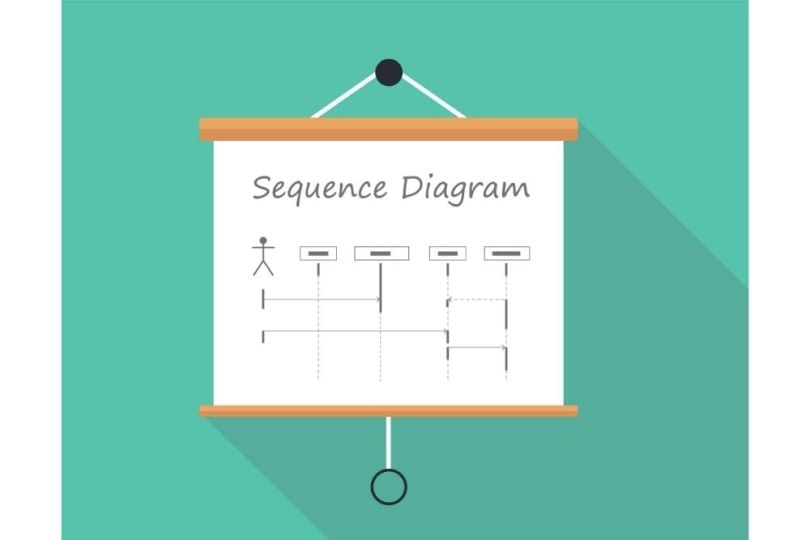
Sequence Diagram
One of the most popular behavioral diagrams is the sequence diagram, which complements class diagrams. Sequence diagrams depict how instances of classes interact with one another, and they also operate on a level that suits technical audiences. In a sequence diagram, the paths that software takes are shown vertically and interactions are represented with arrows.
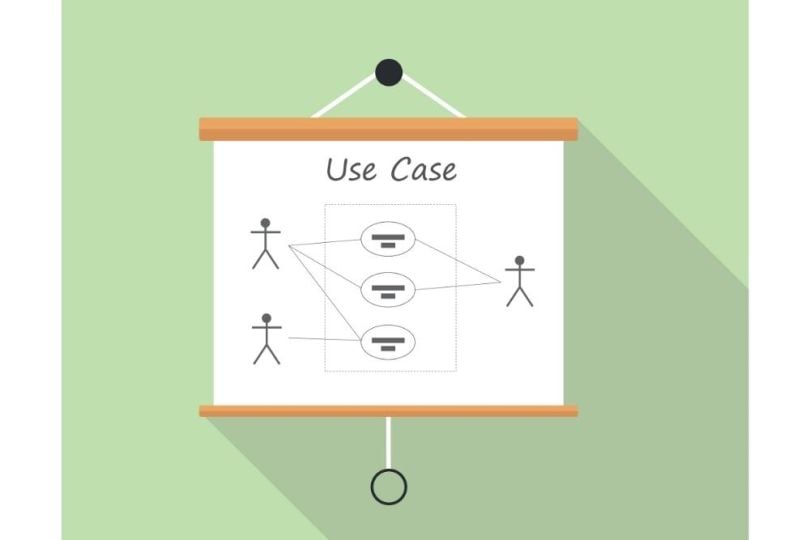
Use-Case Diagram
And then there is the use-case diagram, a behavioral diagram that maps out the different categories of users who interact with the system. Baker said use-case diagrams are helpful for understanding how a system functions in response to different user behaviors. This type of UML diagram is ideal for the beginnings of a project because users are easily identifiable with the system.
Component Diagram
Another popular structural diagram is the component diagram, commonly used when planning a project’s architecture, Baker said.
It depicts a system’s architectural components and those components’ interfaces, represented by rectangles and different types of lines connecting them. Component diagrams are typically used when complex systems with many components are being worked with.
How UML Diagrams Are Used
There are two factors that determine which UML diagram should be used for a given situation: the audience that’s viewing the diagram and the type of project you’re working on.
“If you’re on the development side and you’re trying to get a customer to sign off on some things, you might have a different focus than if you’re an architect who’s trying to help guide a group of developers,” Baker said.
When product managers present solutions to a client, a class diagram is probably not the right choice, Baker said — it’s very detailed, and clients generally want to see the big picture. Instead, he recommended using component diagrams, along with sequence and use-case diagrams to explain the behavior.
Use-case diagrams are great for non-technical audiences, Jayasundara said. Especially during project requirements gathering, they can help map out scenarios for how different users would interact with a system.
Jayasundara also recommended flowchart diagrams for the beginning of projects. Flowcharts are not a type of UML diagram, but they are also standardized and depict high-level overviews of systems.
A project’s industry also determines which diagram is best suited. For instance, the automotive industry doesn’t focus on traditional user interfaces on screens — instead, software development for these “embedded” systems focuses on the states of the vehicle. State diagrams, a type of behavioral diagram, are helpful in the automotive industry because they can describe how different states of the vehicle should relate to one another.
Baker said that, as vehicles become more computerized, things that used to be managed mechanically are increasingly managed by software. An example of this is software-controlled shifting, in what’s known as “shift-by-wire.”
“It’s important, if I’m in Drive, that I can’t do some types of shifting,” Baker said. “So they often like to specify their operations using state machines. If you’re in the embedded world, that’s an important aspect to you.”
Different industries often even have sub-standards within UML. There are standards for business process modeling, systems modeling and even customizations for specific organizations, such as defense contract management, Baker said.
Communicating Effectively With UML
It can be overwhelming to choose between all the different diagrams. Jayasundara said people shouldn’t expect to use all of the diagrams all at once.
“Pick the basics,” he added. “Class diagrams and sequence diagrams are the most basic things that anyone using UML would be drawing, and then you might draw a component or deployment diagram. If you just stick with those initially, they are fairly straightforward to understand.”
Baker said that, once a diagram is chosen, the aim should be to keep the diagram’s scope narrow and avoid cluttering it with extraneous information.
“You can really overwhelm a diagram — have lots of things and have it too big,” Baker said. “And if you’re trying to fit it onto a page, everything’s really small and you can’t read it, so it’s important to maintain some sort of focus for those diagrams.”
Deciding what to leave out can be tricky. According to Baker, the best way for keeping the scope narrow is to consider the diagram’s purpose and its audience. He also recommended using modeling software, which can filter out parts of the diagrams that aren’t relevant for different scenarios.
Knowing which diagram to use and how to use it gets easier with more experience. But it’s a skill worth investing in, because creating good diagrams is an important communication tool. Jayasundara said that, whenever you’re discouraged by all the details, it’s good to remember that diagrams exist to help you communicate in a clear and concise way.
“It’s just about trying to communicate something,” Jayasundara said. “So it’s important to understand the basics and try not to be bogged down.”