When sign-ups are soaring, monthly active users are steady and the Net Promoter Score is looking solid, most product managers would call that a win. However, those green-light indicators don’t always lead to success and can sometimes even hide a precipitous downfall.
That’s because, lurking behind those positive data points, is another set of indicators called dark metrics. These sneaky indicators point to hidden friction, users quietly drifting away or frustrations bubbling up long before they decide to leave for good. They reveal when a product's performance is starting to slip, but they often go unnoticed in standard dashboards.
3 Dark Metrics to Track
- Churn latency: This refers to the time that passes between a user’s last significant activity and the point at which they officially decide to leave.
- Engagement cliff: This is the sudden and significant drop in user activity that’s linked to a specific point of friction.
- Activation reversion: This refers to the number of users who sign up and activate the account and then vanishes right after.
You won’t stumble upon these insights by chance — you need to actively seek them out, track them down and make sense of what they mean. Ignoring dark metrics can result in:
- Skewed growth stories.
- Missed early signs of churn.
- Halted product progress.
Let’s dive into three crucial types of dark metrics and how to identify them.
3 Types of Dark Metrics to Know
1. Churn Latency
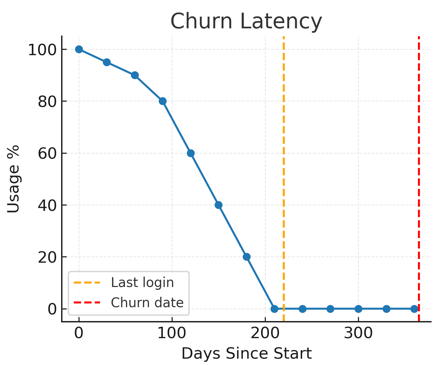
Churn latency refers to the time that passes between a user’s last significant activity and the point at which they officially decide to leave. Interestingly, many users start to “mentally churn” long before they actually cancel.
Why should you care? Because if you’re only tracking churn at the point of cancellation, you’ve already missed the boat.
For example, consider a SaaS company with annual subscriptions:
- Last login: Day 220
- Renewal date: Day 365
- If they don’t renew, that means 145 days of disengagement before they actually churn.
Let’s break it down with some numbers:
In a cohort of 1,000 customers up for renewal:
- 200 have been inactive for over 90 days.
- Out of those, 160 end up churning (that’s an 80 percent prediction accuracy).
Therefore, the key takeaway is keeping an eye on churn latency so you can spot and re-engage customers who are at risk of leaving before they mentally check out.
2. Engagement Cliffs
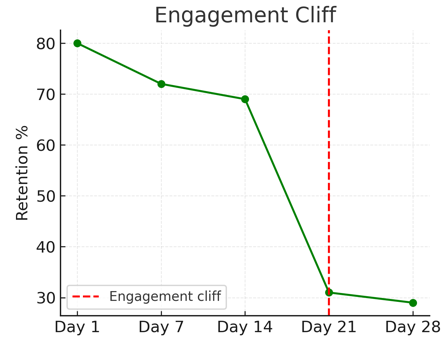
Engagement cliff refers to a sudden and significant drop in user activity that’s linked to a specific point of friction.
These cliffs highlight where your product might be causing frustration or failing to meet user needs. For instance, in a budgeting app, you might see:
- Day 1 retention: 80 percent
- Day 7: 72 percent
- Day 14: 69 percent
- Day 21: 31 percent. This is the cliff.
It’s important to examine what might be causing this drop. In this example, it coincided with the requirement to link a bank account, which can be a trust barrier for many users.
Looking at the numbers:
- 70 percent of users start this step.
- Only 30 percent complete it. That’s a 40 percent loss in just one step.
The key takeaway here is to identify these cliffs and work on smoothing them out to avoid significant drops in user engagement.
3. Activation Reversion
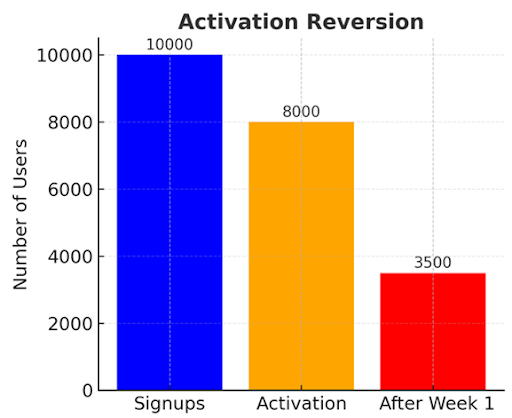
Activation reversion happens when a user reaches the activation milestone but doesn’t really engage afterward. If a user activates their account and then vanishes right after, it isn’t really a win. For example: A social media app shows:
- 900,000 users complete onboarding.
- Only 400,000 come back after day one.
- Activation reversion: 55 percent.
Case in Numbers:
- 10,000 users start a trial.
- 8,000 reach activation.
- Only 3,500 return within a week, which amounts to a 56 percent reversion.
Takeaway here is to redefine activation to mean “settled in,” rather than just “checking a box.”
Dark Metrics Collection Framework
1. Define Real Outcomes First
- Identify your product’s North Star metric.
- Break it into supporting behavioral KPIs (avoid vanity metrics).
- Ask: Which behaviors signal lasting value for the user?
2. Audit Current Metrics for Vanity Signals
- List all dashboard metrics.
- Label each as “Vanity” or “Value-based.”
- Ask: Is this action driven by genuine value or accidental/incentivized behavior?
- Check if it predicts retention or revenue.
3. Reveal Hidden Patterns with Behavioral Analysis
- Gather data from funnels, session replays, rage clicks and event streams.
- Look for activation reversion, churn latency and engagement cliffs.
4. Keep Segmenting Until It Hurts
- Cut the data in every way possible — by user type, device, location, how they found you, even what they paid for. That’s usually where the real surprises show up.
- Identify who’s truly succeeding vs. just passing through.
5. Surface Insights & Strategize Next Steps
- Share dark metric findings in product reviews alongside success metrics.
- Prioritize issues that affect core user journeys, happen early in the lifecycle and show repeated frustration.
Why Dark Metrics Matter for Every Product Manager
Dark metrics reveal the hidden flaws that lie beneath a facade of success — the problems that can quietly disrupt growth, user satisfaction and retention.
1. Uncover Misleading Indicators
A surge in sign-ups can mask poor retention rates. Dark metrics show when a product is being accessed but not genuinely utilized.
2. Avoid Vanity Metrics
Metrics like page views, downloads and daily active users don’t mean much without retention, success or revenue. Dark metrics shift the focus from “looks impressive” to “actually works.”
3. Identify Weaknesses Early
Monitor unused features, points where users drop off, and superficial engagement. Spending time in the app isn’t a win if users are just stuck.
4. Create Smarter Experiments
Pinpoint failed activations, shallow engagement, and artificial retention to conduct more focused A/B tests.
5. Align Teams on Genuine Outcomes
Provide UX, marketing and customer success teams with a shared, reality-based understanding of user health.
Dark metrics empower product managers to prioritize by highlighting vulnerabilities hidden beneath surface-level numbers, optimize by concentrating on user behavior rather than mere events, align teams with an accurate view of product health, scale responsibly by steering clear of misleading growth signals and retain users by uncovering when and why they churn — even if it’s quietly.