

The correlation matrix is a matrix that shows the correlation between variables. It gives the correlation between all the possible pairs of values in a matrix format.

We can use a correlation matrix to summarize a large data set and to identify patterns and make a decision according to it. We can also see which variable is more correlated to which variable, and we can visualize our results.
A correlation matrix involves a rows and columns table that shows the variables. Every cell in a matrix contains the correlation coefficient. The correlation matrix is in conjunction with other types of statistical analysis.
It’s very useful for regression techniques like simple linear regression, multiple linear regression and lasso regression models. In the regression technique, we have several independent variables, and based on that, we are predicting the dependent variable.
What Is a Correlation Matrix?
A correlation matrix is a statistical technique used to evaluate the relationship between two variables in a data set. The matrix is a table in which every cell contains a correlation coefficient, where 1 is considered a strong relationship between variables, 0 a neutral relationship and -1 a not strong relationship. It’s most commonly used in building regression models.
In multiple linear regression, the correlation matrix determines the correlation coefficients between the independent variables of a model.
When Do You Use the Correlation Matrix?
The correlation matrix gives you an idea about your data set.
For example, let’s say you want to predict the price of a car on the basis of fuel type, transmission type or age, etc. A correlation matrix would be very useful.
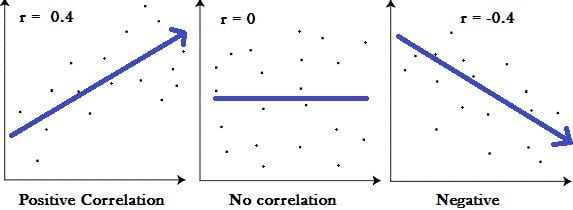
Using a correlation matrix, we can evaluate the relationship between two variables:
- If the relationship is 1, then the relationship is strong.
- If the relationship is 0, then it means the relationship is neutral.
- If the relationship is -1, then it means the relationship is negative or not strong.
- By using a correlation matrix, you can better understand your data set, analyze it and visualize the result.
- Most data scientists consider this the main step before building any machine learning model because if you know which variables are correlated which, you can gain a better understanding about what’s most important for your model.
- The correlation matrix is a statistical technique that gives you the values between -1 to 1 which you can determine the relationship between variables.
Finding the Correlation Coefficient in a Correlation Matrix
Correlation Coefficient
Before building a correlation matrix, you need to understand what a correlation coefficient is and its different types.
Correlation coefficients are used to determine how strong a relationship is between two variables. There are several types of correlation coefficients.
Types of Correlation coefficients:
- Sample correlation coefficients.
- Population correlation coefficients.
- Pearson correlation coefficients.
How to Calculate Correlation Coefficient
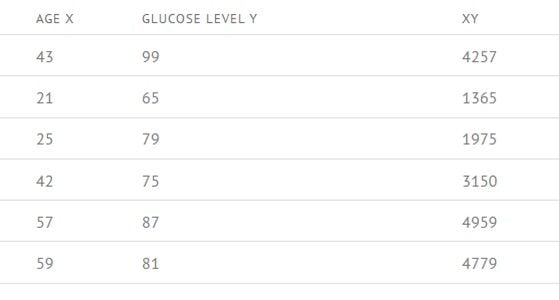
For example, let’s find the correlation coefficient of the given table

Step 1: Calculate AGE X * GLUCOSE LEVEL Y for each value in the table.
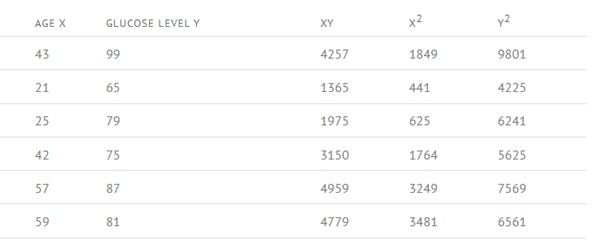
Step 2: Now calculate X2 and Y2 for each value in the table.
Step 3: Now calculate the sigma (Σ) for every column.
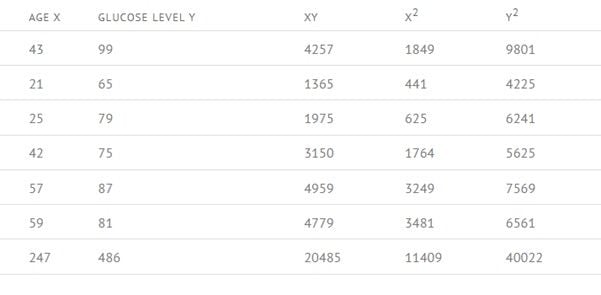
Step 4: Now we are going to use the Pearson correlation coefficient formula.

Values are: n = 6, Σxy = 20485, Σx = 247, Σy = 486, Σ = 11409, Σ = 40022, r = 0.5298……(from formula).
By putting values inside this formula, we can calculate how strong the relationship is between two variables. So, by entering those values, we get 0.5298, which means our relationship is greater than neutral and less than positive
That’s how we can calculate the correlation coefficient of each value and make a matrix from it.
Correlation Matrix Implementation in Python
We can easily implement a correlation matrix in Python because Python has a large library of support, and for statistical analysis, we can use Pandas and NumPy.
Most data analysts implement their correlation matrix in Python because Python has a powerful package that helps us to do data pre-pressing, and we can make great visualizations.
There are some certain steps you need to follow to implement the correlation matrix:
Step 1: Collect the Data From Various Sources
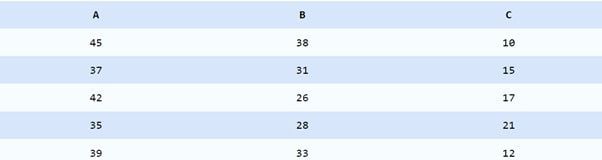
Collect the data from various sources for the correlation matrix. The following data is about three variables.
Step 2: Create a DataFrame of A, B, C Using Pandas
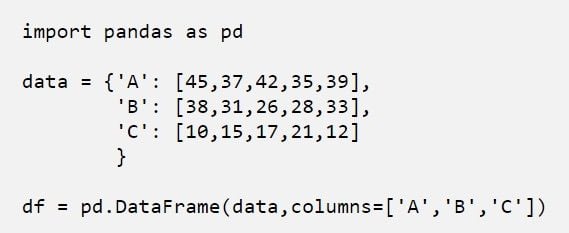
We’ve now created a DataFrame using Pandas. Now, we have three variables, A, B and C.
Step 3: Create a Correlation Matrix Using the “Corr” Function

Output:
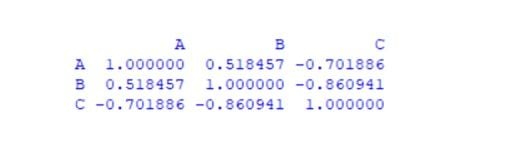
By using the corr function we have created a correlation matrix that looks like the above image.
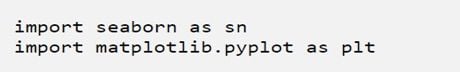
Step 3: Visual Representation of Correlation Matrix Using Matplotlib and Seaborn
Output:

That’s how you can implement a correlation matrix in Python, through which we can get a better understanding about which variables are highly correlated to each other.
Correlation Matrix Applications
- We can summarize a large amount of data in which the goal is to identify patterns. In our example above, the observable pattern is that all the variables highly correlate with each other.
- To input into other analyses. For example, people commonly use the correlation matrix as inputs for exploratory factor analysis, confirmatory factor analysis, structural equation models, and linear regression when excluding missing values pairwise.
- As a diagnostic when checking other analyses For example, with linear regression, a high number of correlations suggests that the linear regression estimates will be unreliable.
We can use the correlation matrix in the machine learning model to improve accuracy, and we can create a confusion matrix to understand the data.
We can use this statistical technique in the health care sector as well to predict diseases.
Correlation Matrix Advantages
The correlation matrix is a very useful statistical technique by which we can gain a better understanding of our data set and get a summary of it. That way we can analyze the data and make a decision according to it. If you are building any machine learning model, this technique can help you select which data and features will be most impactful. The correlation matrix is the most popular statistical technique, so it has large support and it can easily be implemented in Python or any other programming language.