Companies have a great interest in clearly communicating their ML-based predictive analytics to their clients. No matter how accurate a model is, clients want to know how machine learning models make predictions from data. For example, if a subscription-based company is interested in finding customers who are at high risk of canceling their subscriptions, they can use their historical customer data to predict the likelihood of someone leaving.
From there, they would want to analyze the factors that drive this event. By understanding the driving factors, they can take actions like targeted promotions or discounts to prevent the customer from leaving. Without understanding the factors that influence any given outcome, using machine learning models to make decisions is difficult.
A common way companies communicate data insights and machine learning model results is through analytics dashboards. Tools like Tableau, Alteryx or even a customized tool using web frameworks like Django or Flask make creating these dashboards easy.
What Is Streamlit?
In practice, however, creating these types of dashboards is often very expensive and time consuming. A good alternative to the more traditional approaches, then, is using Streamlit. Streamlit is a Python-based library that allows you to create free machine learning applications with ease. You can easily read in a saved model and interact with it with an intuitive and user friendly interface. It allows you to display descriptive text and model outputs, visualize data and model performance, modify model inputs through the UI using sidebars and much more.
Overall, Streamlit is an easy-to-learn framework that allows data science teams to create free predicitve analytics web applications in as little as a few hours. The Streamlit gallery shows many open-source projects that have used it for analytics and machine learning. You can also find documentation for Streamlit here.
Because of its ease of use and versatility, you can use Streamlit to communicate a variety of data insights. This includes information from exploratory data analysis (EDA), results from supervised learning models such as classification and regression, and even insights from unsupervised learning models.
For our purposes, we will consider the classification task of predicting whether or not a customer will stop making purchases with a company, a condition known as churn. We will be using the fictitious Telco churn data for this project.
Building and Saving a Classification Model in Python
We will start by building and saving a simple churn classification model using random forests. To start, let’s create a folder in terminal using the following command:
mkdir my_churn_appNext, let’s change directories into our new folder:
cd my_churn_appNow, let’s use a text editor to create a new Python script called churn-model.py. Here, I’ll use the vi text editor:
vi churn-model.pyNow, let’s import a few packages. We will be working with Pandas, RandomForestClassifier from Scikit-learn and Pickle:
import pandas as pd

from sklearn.ensemble import RandomForestClassifier

import pickle
Now, let’s relax display limits on our Pandas data frames rows and columns, then read in and display our data:
pd.set_option('display.max_columns', None)

pd.set_option('display.max_rows', None)

df_churn = pd.read_csv('telco_churn.csv')

print(df_churn.head())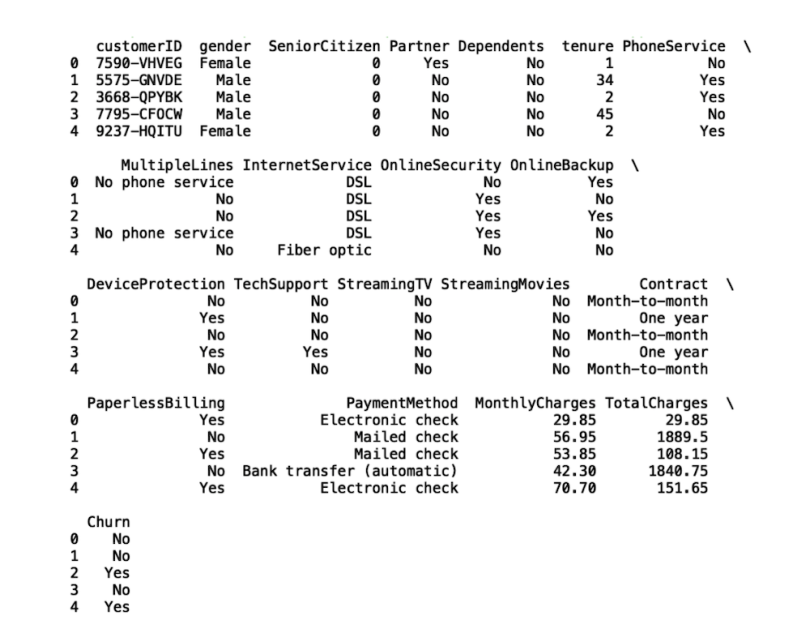
Let’s filter our data frame so that it only has the columns Gender, PaymentMethod, MonthlyCharges, Tenure and Churn. The first four of these columns will be input into our classification model, and our output is Churn:
pd.set_option('display.max_columns', None)

pd.set_option('display.max_rows', None)

df_churn = pd.read_csv('telco_churn.csv')

df_churn = df_churn[['gender', 'PaymentMethod', 'MonthlyCharges',

'tenure', 'Churn']].copy()

print(df_churn.head())
Next, let’s store a copy of our data frame in a new variable called df and replace missing values with zero:
df = df_churn.copy()

df.fillna(0, inplace=True)
Next, let’s create machine-readable dummy variables for our categorical columns Gender and PaymentMethod:
encode = ['gender','PaymentMethod']

for col in encode:

    dummy = pd.get_dummies(df[col], prefix=col)

    df = pd.concat([df,dummy], axis=1)

    del df[col]
Next, let’s map the churn column values to binary values. We’ll map the churn value Yes to a value of one, and No to a value of zero:
import numpy as np

df['Churn'] = np.where(df['Churn']=='Yes', 1, 0)

Now, let’s define our input and output :

X = df.drop('Churn', axis=1)

Y = df['Churn']
Then we define an instance of the RandForestClassifier and fit our model to our data:
clf = RandomForestClassifier()

clf.fit(X, Y)
Finally, we can save our model to a Pickle file:
pickle.dump(clf, open('churn_clf.pkl', 'wb'))Now, in a terminal, let’s run our Python script with the following command:
python churn-model.pyThis should generate a file called churn_clf.pkl in our folder. This is our saved model.
Next, in a terminal, install Streamlit using the following command:
pip install streamlitLet’s define a new Python script called churn-app.py. This will be the file we will use to run our Streamlit application:
vi churn-app.pyNow, let’s import some additional libraries. We will import Streamlit, Pandas, Numpy, Pickle, Base64, Seaborn and Matplotlib:
import streamlit as st

import pandas as pd

import numpy as np

import pickle

import base64

import seaborn as sns

import matplotlib.pyplot as plt
Displaying Text With Streamlit
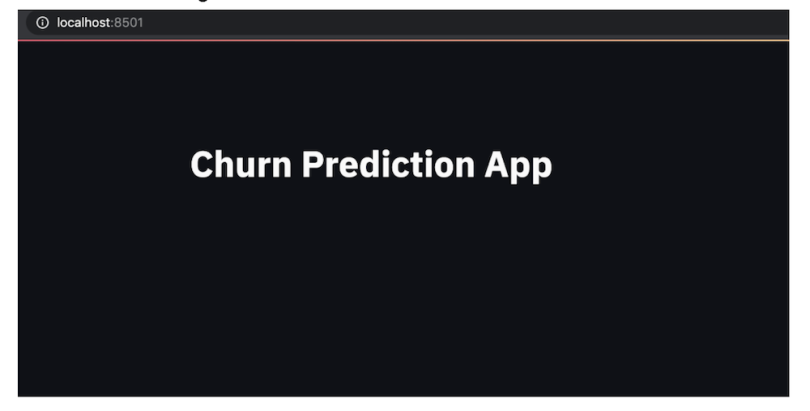
The first thing we will walk through is how to add text to our application. We do this using the write method on our Streamlit object. Let’s create our application header, called Churn Prediction App.
We can run our app locally using the following command:
streamlit run churn-app.pyWe should see this:
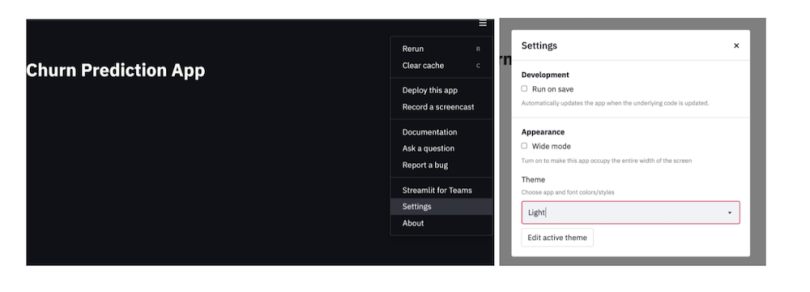
From the dropdown menu on the upper right side of our app, we can change the theme from dark to light:
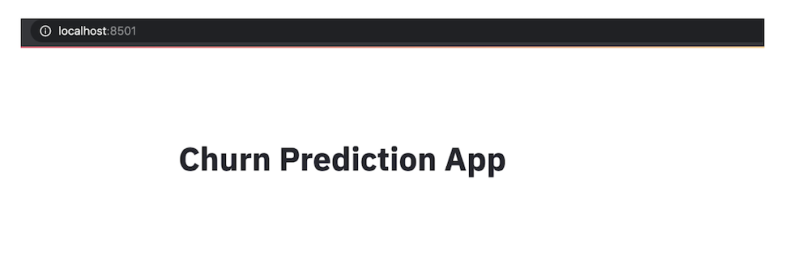
Now our app should look like this:
Finally, let’s add a bit more descriptive text to our UI and rerun our app:
st.write("""

# Churn Prediction App

Customer churn is defined as the loss of customers after a certain period of time. Companies are interested in targeting customers

who are likely to churn. They can target these customers with special deals and promotions to influence them to stay with

the company.

This app predicts the probability of a customer churning using Telco Customer data. Here

customer churn means the customer does not make another purchase after a period of time.

""")
Allowing Users to Download Data With Steamlit
The next thing we can do is modify our app so that users can download the data that trained their model. This is useful for performing any analysis that isn’t supported by the application. To do this, we first read in our data:
df_selected = pd.read_csv("telco_churn.csv")

df_selected_all = df_selected[['gender', 'Partner', 'Dependents',
'PhoneService','tenure', 'MonthlyCharges', 'target']].copy()
Next, let’s define a function that allows us to download the read-in data:
def filedownload(df):

    csv = df.to_csv(index=False)

    b64 = base64.b64encode(csv.encode()).decode()  # strings <-> bytes

conversions

    href = f'<a href="data:file/csv;base64,{b64}"

download="churn_data.csv">Download CSV File</a>'

    return href
Next, let’s specify the showPyplotGlobalUse deprecation warning as False.
st.set_option('deprecation.showPyplotGlobalUse', False)

st.markdown(filedownload(df_selected_all), unsafe_allow_html=True)
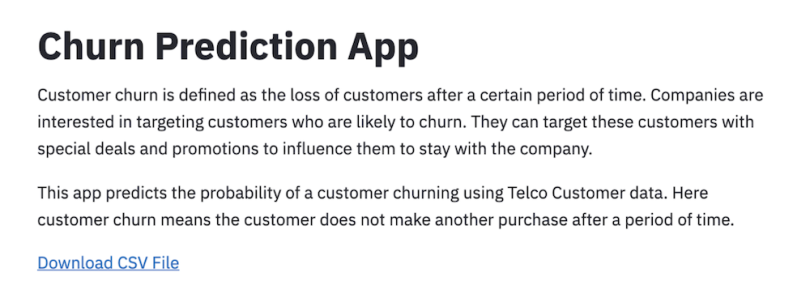
And when we rerun our app we should see the following:
Numerical Input Slider and Categorical Input Select Box
Another useful thing we can do is create input sidebars for users that allow them to change the input values and see how it affects churn probability. To do this, let's define a function called user_input_features:
def user_input_features():

    pass
Next, let’s create a sidebar for the categorical columns Gender and PaymentMethod.
For categorical columns, we call the Selectbox method on the sidebar object. This first argument of the Selectbox method is the name of the categorical column:
def user_input_features():

    gender = st.sidebar.selectbox('gender',('Male','Female'))

    PaymentMethod = st.sidebar.selectbox('PaymentMethod',('Bank transfer (automatic)', 'Credit card (automatic)', 'Mailed check', 'Electronic check'))

    data = {'gender':[gender],

            'PaymentMethod':[PaymentMethod],

            }


    features = pd.DataFrame(data)

    return features
Let’s call our function and store the return value in a variable called input:
input_df = user_input_features()Now, let’s run our app. We should see a dropdown menu option for Gender and PaymentMethod:
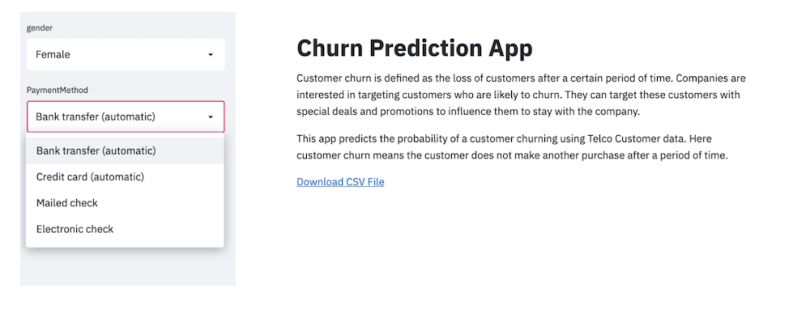
This technique is powerful because users can select different methods and see how much more likely a customer is to churn based on the payment method. For example, if bank transfers result in a higher probability of churn, maybe a company will create targeted messaging to these customers encouraging them to change their payment method type. They may also choose to offer some sort of financial incentive for changing their payment type. The point is these types of insights can drive decision making for companies, allowing them to retain customers better.
We can also add MonthlyCharges and tenure:
def user_input_features():

    gender = st.sidebar.selectbox('gender',('Male','Female'))

    PaymentMethod = st.sidebar.selectbox('PaymentMethod',('Bank transfer (automatic)', 'Credit card (automatic)', 'Mailed check', 'Electronic check'))

    MonthlyCharges = st.sidebar.slider('Monthly Charges', 18.0,118.0, 18.0)

    tenure = st.sidebar.slider('tenure', 0.0,72.0, 0.0)

    data = {'gender':[gender],

            'PaymentMethod':[PaymentMethod],

            'MonthlyCharges':[MonthlyCharges],

            'tenure':[tenure],}


    features = pd.DataFrame(data)

    return features

input_df = user_input_features()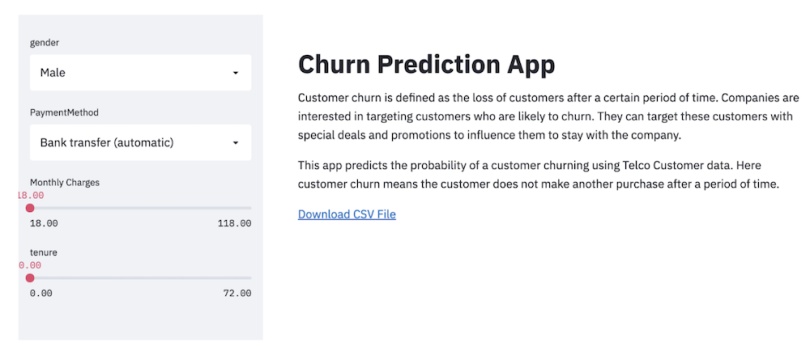
The next thing we can do is display the output of our model. In order to do this, we first need to specify default input and output if the user does not select any. We can insert our user input function into an if/else statement, which says use the default input if the user does not specify input.
Here, we will also give the user the option to upload a CSV file containing input values with the sidebar method file_uploader():
uploaded_file = st.sidebar.file_uploader("Upload your input CSV file", type=["csv"])

if uploaded_file is not None:

    input_df = pd.read_csv(uploaded_file)

else:

    def user_input_features():

        … #truncated code from above

        return features

    input_df = user_input_features()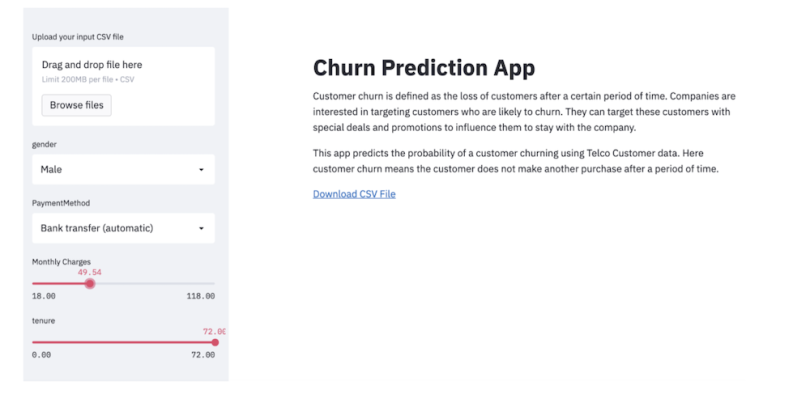
Next, we need to display the output of our model. First, let’s display the default input parameters. We read in our data:
churn_raw = pd.read_csv('telco_churn.csv')

churn_raw.fillna(0, inplace=True)

churn = churn_raw.drop(columns=['Churn'])

df = pd.concat([input_df,churn],axis=0)
Encode our features:
encode = ['gender','PaymentMethod']

for col in encode:

    dummy = pd.get_dummies(df[col], prefix=col)

    df = pd.concat([df,dummy], axis=1)

    del df[col]

df = df[:1] # Selects only the first row (the user input data)

df.fillna(0, inplace=True)

Select the features we want to display:

features = ['MonthlyCharges', 'tenure', 'gender_Female', 'gender_Male',

       'PaymentMethod_Bank transfer (automatic)',

       'PaymentMethod_Credit card (automatic)',

       'PaymentMethod_Electronic check', 'PaymentMethod_Mailed check']

df = df[features]

Finally, we display the default input using the write method:

# Displays the user input features

st.subheader('User Input features')

print(df.columns)

if uploaded_file is not None:

    st.write(df)

else:

    st.write('Awaiting CSV file to be uploaded. Currently using example input parameters (shown below).')

    st.write(df)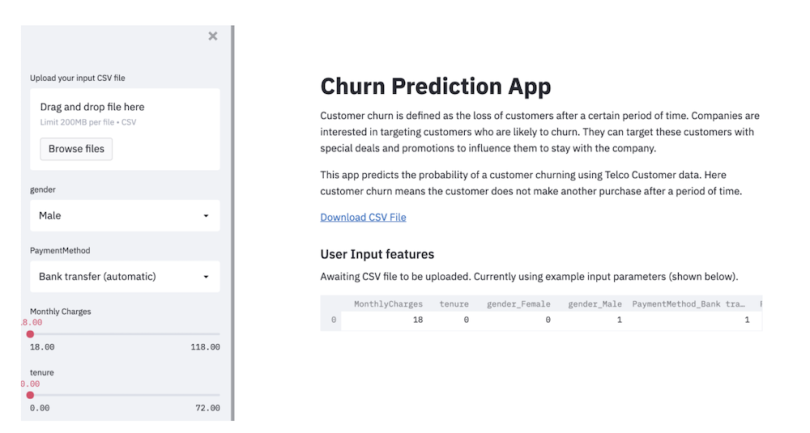
Now, we can make predictions and display them either using the default input or the user input. First, we need to read in our saved model, which is in a Pickle file:
load_clf = pickle.load(open('churn_clf.pkl', 'rb'))Generate binary scores and prediction probabilities:
prediction = load_clf.predict(df)

prediction_proba = load_clf.predict_proba(df)

And write the output:

churn_labels = np.array(['No','Yes'])

st.write(churn_labels[prediction])

st.subheader('Prediction Probability')

st.write(prediction_proba)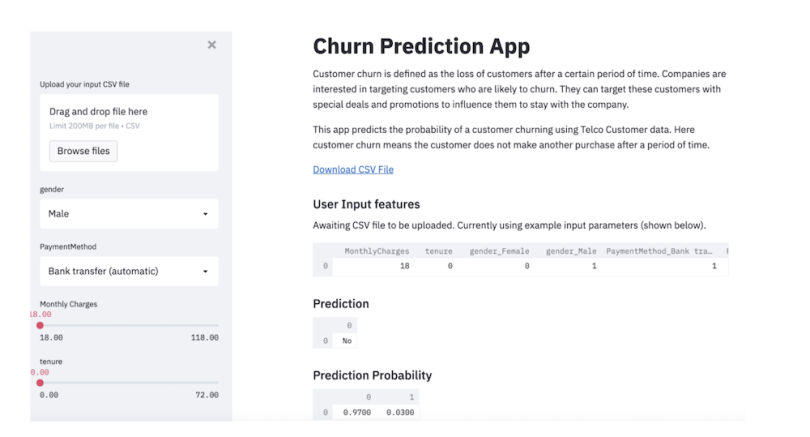
We see that new male customers with monthly charges of $18 using bank transfer as their payment type have a 97 percent probability of staying with the company. We’re now finished building our application. The next thing we will do is deploy it to a live website using Heroku.
Deploying Applications With Streamlit
Web application deployment is another time-consuming and expensive step in the ML pipeline. Heroku makes quickly deploying web applications free and easy.
To start, we need to add a few additional files to our application folder. We will add a setup.sh file and a Procfile. Streamlit and Heroku will use these files to configure the environment before running the app. In the application folder, in terminal, create a new file called setup.sh:
vi setup.shIn the file copy, paste the following:
mkdir -p ~/.streamlit/


echo "\

[server]\n\

port = $PORT\n\

enableCORS = false\n\

headless = true\n\

\n\

" > ~/.streamlit/config.toml
Save and leave the file. The next thing we need to create is a Procfile.
vi ProcfileCopy and paste the following into the file:
web: sh setup.sh && streamlit run churn-app.pyFinally, we need to create a requirement.txt file. We’ll add the package versions for the libraries we have been using there:
streamlit==0.76.0

numpy==1.20.2

scikit-learn==0.23.1

matplotlib==3.1.0

seaborn==0.10.0
To check your package versions, you can run the following in terminal:
pip freezeWe are now prepared to deploy our application. Follow these steps to deploy:
-
To start, log into your Github account if you have one. If you don’t, create a Github account first.
-
On the left-hand panel, click the green New button next to where it says Repositories.
-
Create a name for your repository. {yourname}-churn-app should be fine. For me, it would be sadrach-churn-app.
-
Click on the link Upload an Existing File and click on Choose Files.
-
Add all files in codecrew_churn_app-main to the repo and click Commit.
-
Go to Heroku.com and create an account.
-
Log in to your account.
-
Click on the New button on the upper right and click Create New App.
-
You can name the app whatever you’d like. I named my app as follows: {name}-churn-app. I.e.: sadrach-churn-app and click Create App.
-
In the deployment method, click GitHub
-
Connect to your GitHub repo.
-
Log in and copy and paste the name of your repo. Click Search and Connect.
-
Scroll down to Manual Deploy and click Deploy Branch.
-
Wait a few minutes, and your app should be live!
You can find my version of the churn application here and the GitHub repository here.
Start Using Streamlit Today
Streamlit is a powerful library that allows quick and easy deployment of machine learning and data applications. It allows developers to create intuitive user interfaces for machine learning models and data analytics. For machine learning model predictions, this means greater model explainability and transparency, which can aid decision making for companies. A known issue companies face with many machine learning models is that, regardless of accuracy, there needs to be some intuitive explanation of which factors drive events.
Streamlit provides many avenues for model explainability and interpretation. The sidebar objects enable developers to create easy-to-use sliders that allow users to modify numerical input values. It also provides a select box method that allows users to see how changing categorical values affects event predictions. The file upload method allows users to upload input in the form of a csv file and subsequently display model predictions.
Although our application was focused on a churn classification model, Streamlit can be used for other types of machine learning models both supervised and unsupervised. For example, building a similar web application for a regression machine learning model such as housing price prediction would be relatively straightforward.
Further, you can use Streamlit to develop a UI for an unsupervised learning tool that uses methods like K-means or hierarchical clustering. Finally, Streamlit is not limited to machine learning. You can use it for any data analytics task like data visualization or exploration.
In addition to enabling straightforward UI development, using Streamlit and Heroku both take much of the hassle out of web application deployment. As we saw in this article, we can easily deploy a live machine learning web application in just a few hours, compared to the months a traditional approach would take.


