

Understanding the wavelet transform is straightforward once you have a solid grasp on how the Fourier transform works. I’ll start with a review of the Fourier transform, discuss key ideas of the wavelet transform and conclude with a concrete example with MATLAB code. You can follow along with the example code.
Wavelet Transform vs. Fourier Transform
What Is the Fourier Transform?
An idea you’ll find all over science, math and engineering is the Fourier transform (FT). The FT decomposes a function into simple sines and cosines (i.e. waves). In theory, any function can be represented in this way — that is, as a sum of (possibly infinite) sine and cosine functions of different amplitudes and frequencies.
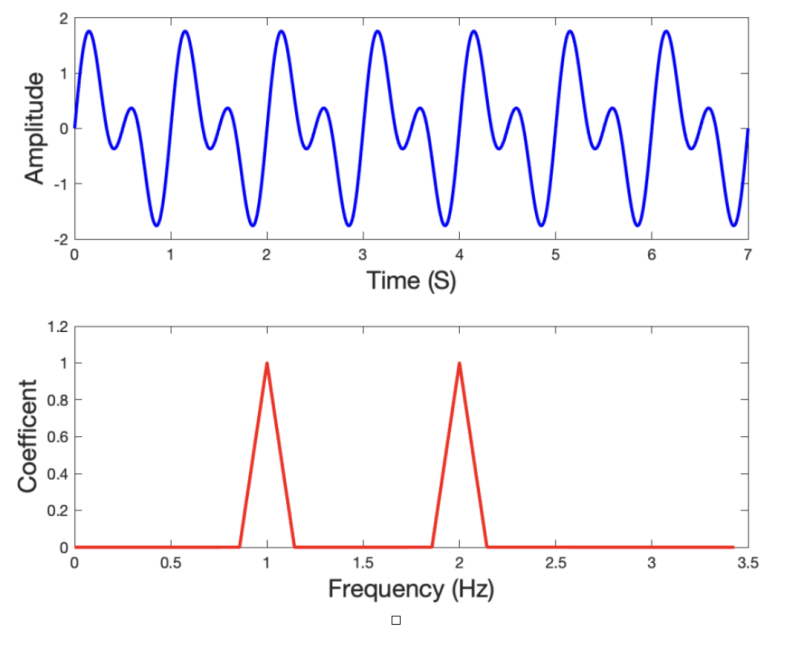
I’ve provided a toy example below. Here, I’ve translated the top signal from the time domain to the frequency domain. In other words, we change the x-axis from time to frequency. The way to interpret peaks in the bottom plot is that the original signal represents the sum of two simple sine waves with frequencies one and two Hz, respectively.
You can find the code at the accompanying GitHub repo.
What Is Wavelet Transform?
A major disadvantage of the Fourier transform is it captures global frequency information, meaning frequencies that persist over an entire signal. This kind of signal decomposition may not serve all applications well, for example electrocardiography (ECG), where signals have short intervals of characteristic oscillation. An alternative approach is the wavelet transform, which decomposes a function into a set of wavelets.
The two main types of wavelet transformation are continuous wavelet transformation (CWT) and discrete wavelet transformation (DWT). For discretizing the scale parameter, CWT uses exponential scales with a base smaller than 2, while DWT uses exponential scales with a base equal to 2.
What’s a Wavelet?
A wavelet is a wave-like oscillation localized in time; I’ve provided an example below. Wavelets have two basic properties: scale and location. Scale (or dilation) defines how stretched or squished a wavelet is. This property relates to frequency as defined for waves. Location defines where the wavelet is positioned in time (or space).
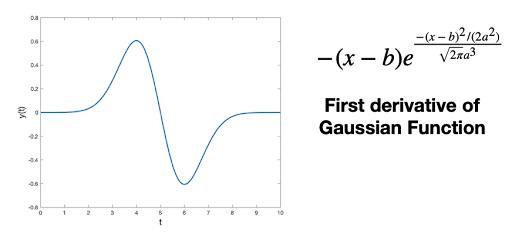
The parameter a in the expression above sets the scale of the wavelet. If we decrease its value the wavelet will look more squished. This in turn can capture high frequency information. Conversely, increasing the value of a will stretch the wavelet and capture low frequency information.

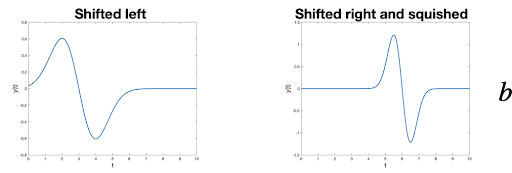
The parameter b defines the location of the wavelet. Decreasing b will shift the wavelet to the left. Increasing b will shift it to the right. Location is important because unlike waves, wavelets are only non-zero in a short interval. Furthermore, when analyzing a signal we are not only interested in its oscillations, but where those oscillations take place.
How Does Wavelet Transform Work?
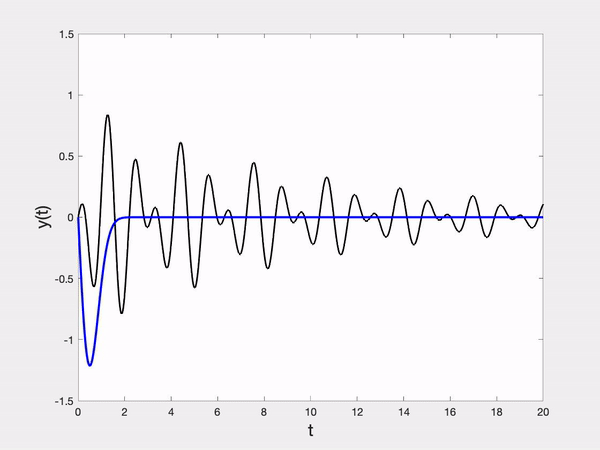
The basic idea is to compute how much of a wavelet is in a signal for a particular scale and location. For those familiar with convolutions, that’s exactly what this is. A signal is convolved with a set of wavelets at a variety of scales.
In other words, we pick a wavelet of a particular scale (like the blue wavelet below). Then, we slide this wavelet across the entire signal (i.e. vary its location), where at each time step we multiply the wavelet and signal. The product of this multiplication gives us a coefficient for that wavelet scale at that particular time step. We then increase the wavelet scale (e.g. the red and green wavelets) and repeat the process.
Why Use Wavelets?
A couple of key advantages of the wavelet transform are:
- Wavelet transform can extract local spectral and temporal information simultaneously.
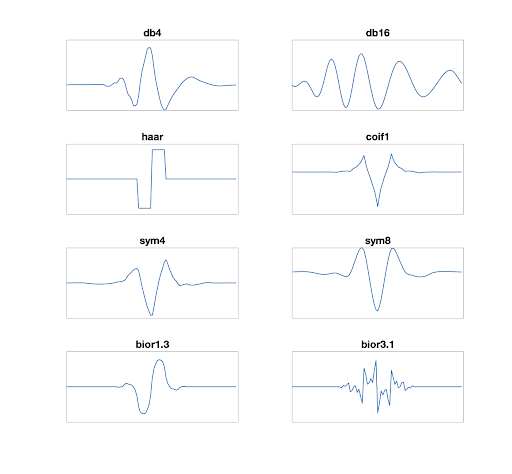
- There are a variety of wavelets from which to choose (like Daubechies, Haar, Morlet, Meyer, Symlet and more).
We have touched on the first key advantage a couple times already but that’s because it’s the biggest reason to use the wavelet transform. This may be preferable to using something like a short-time Fourier transform which requires chopping up a signal into segments and performing a Fourier transform over each segment.
The second key advantage sounds more like a technical detail. Ultimately, the takeaway here is: If you know what characteristic shape you’re trying to extract from your signal, there are a wide variety of wavelets to choose from to best match that shape. I’ve provided a handful of options in the figure below.
Detecting R-Peaks in ECG Signal With Wavelet Transform
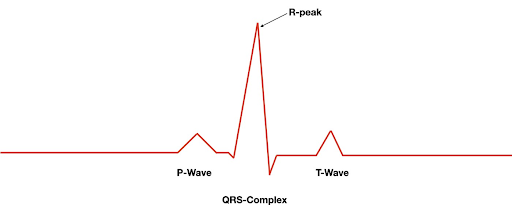
In this example, I use a type of discrete wavelet transform to help detect R-peaks from an electrocardiogram (ECG), which measures heart activity. R-peaks are typically the highest peak in an ECG signal. They are part of the QRS-complex, which is a characteristic oscillation that corresponds to the contraction of the ventricles and expansion of the atria. Detecting R-peaks is helpful in computing heart rate and heart rate variability (HRV).
You can find example code at the GitHub repo.
In the real world, we rarely have ECG signals that look as clean as the above graphic. As seen in this example, ECG data is typically noisy. For R-peak detection, simple peak finding algorithms will fail to generalize when applied to raw data. The wavelet transform can help convert the signal into a form that makes it much easier for our peak finder function.
Here I use the maximal overlap discrete wavelet transform (MODWT) to extract R-peaks from the ECG waveform. I’m using the symlet wavelet with four vanishing moments (sym4) at seven different scales. Below, I’ve plotted the original ECG signal along with wavelet coefficients for each scale over time.
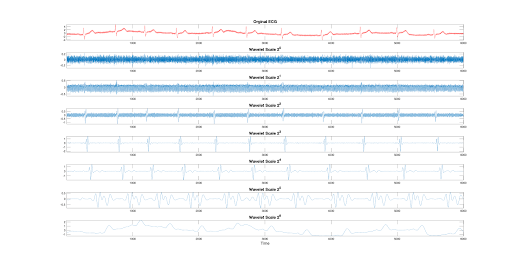
The smaller scales (such as 2⁰ and 2¹) correspond to high frequencies, and thus predominantly consist of noise in this example. As we go up in scale, we see blips emerge from the noise that correspond to R-peaks (i.e. in 2², 2³ and 2⁴). We then lose the signal in the larger scale coefficients (i.e. 2⁵ and 2⁶), which are associated with low frequency information.
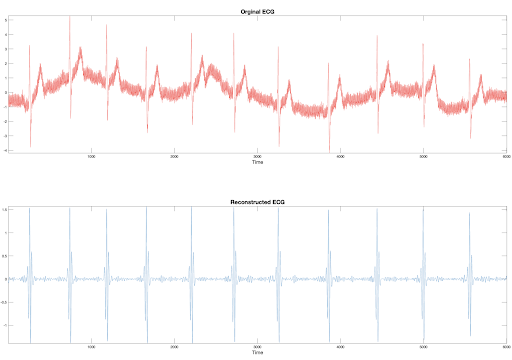
We can then reconstruct the original signal with information from a subset of our wavelet scales. Here I only keep information from one scale, 2³. I’ve plotted the original and reconstructed signals below. We see the peaks in the reconstructed ECG (lower plot) line up reasonably well with the R-peaks. Additionally, applying a peak finder to the reconstructed ECG seems much more promising than to the original ECG.
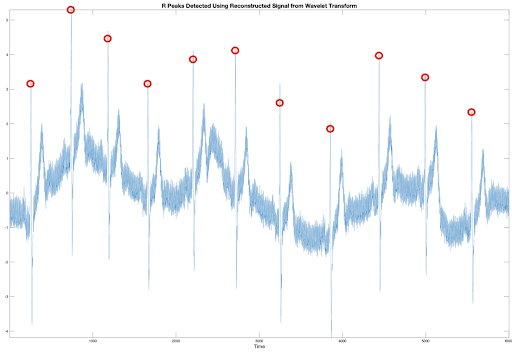
The final step is to apply a find peaks function to the reconstructed signal. This will give approximate timestamps of each R-peak. To evaluate the performance we plot the detected R-peaks on top of the original signal.
As you can see, the key advantage of the wavelet transform compared to the Fourier transform is the ability to extract both local spectral and temporal information. For a deeper dive into the details of the wavelet transform, check out Addison's review.
Frequently Asked Questions
What is the main difference between the Fourier and wavelet transforms?
Fourier transforms break down signals into oscillations that persist over the entire sequence, and wavelet transforms break signals down into oscillations localized in space and time. The Fourier transform captures global frequency information, while the wavelet transform provides both time and frequency localization.
What do scale and location mean in a wavelet?
In a wavelet, scale relates to frequency and how stretched a wavelet is — smaller scales capture high frequencies and larger scales capture low frequencies. Location refers to where the wavelet is positioned in time or space.


