If you’re building web applications today, there’s no escaping Google Chrome. It’s one of the most popular browsers in use today and an important environment for developers to test out their code and applications.
While Chrome has a set of developer tools called Chrome DevTools built directly into the browser, there are many features it lacks. For example, it can be difficult to measure site performance and easily debug front-end code that emphasizes state management.
CHROME EXTENSIONS FOR DEVELOPERS
- CSSViewer
- ColorZilla
- GoFullPage
- Redux DevTools
- Angular DevTools
- React Developer Tools
- JSON Formatter
- EditThisCookie
- Postman Interceptor
- SAML Chrome Panel
- Lighthouse
- Alexa Traffic Rank
- Checkbot
Luckily, third-party developers — and some Google engineers — have built plenty of Chrome extensions to help with different aspects of development and testing. Some extensions can help developers debug tricky front-end styling issues and others can assist with performance and security testing in the browser.
Below are just some of the Chrome browser extensions that can level up your web application development process.
CSS and Styling Extensions
In front-end design, everything a developer writes gets filtered through the browser a person is using. Even if your code seems logical, that doesn’t guarantee it will look as you expect in a live application. That’s why it’s important for developers to test how their code looks in a browser.
CSS, one of the main aspects of styling web applications, is also notoriously tricky. Styling sheets can be long and complex, with different lines of code frequently overwriting each other based on the rules of the hierarchy of CSS code. It’s often hard to tell what the final result will look like just by reading the code.
Because it’s so hard to get right, a lot of testing happens on the front end. These Chrome extensions can help testers and developers see what’s happening in their code and how it looks in the browser. In turn, that can help them communicate more effectively and spot any bugs that turn up.
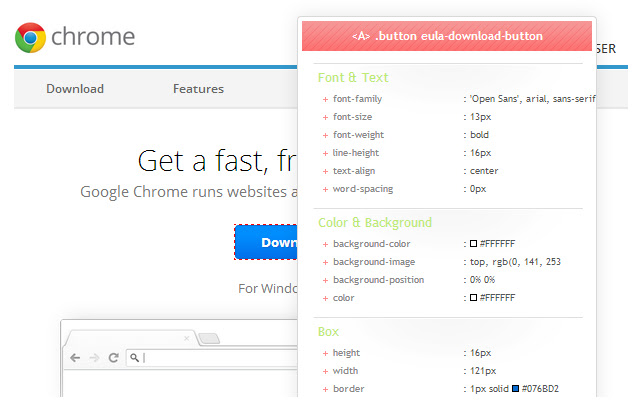
CSSViewer
This tool is for any front-end developer who has ever wished they knew how a cool-looking website was put together. If you want to emulate a certain design — or if you just can’t figure out why your styling code will not look the way you want it to look — CSSViewer gives users a complete summary of the applied CSS attributes and values. It’s simple to use — just hover over an element you want to inspect, and the styling attributes used to create the element will appear.

ColorZilla
Trying to get colors to match can be a pain. Fortunately, this tool saves time that you would have spent hunting through code to find the matching color. Developers can use ColorZilla as an eyedropper tool by pointing a cursor at any part of a webpage to get its color encoding. It also has a convenient color-picker tool that lets users choose a shade from a color wheel to get the code for that color. It also saves a history of your most recently used colors so you don’t have to keep doing the same thing over again.
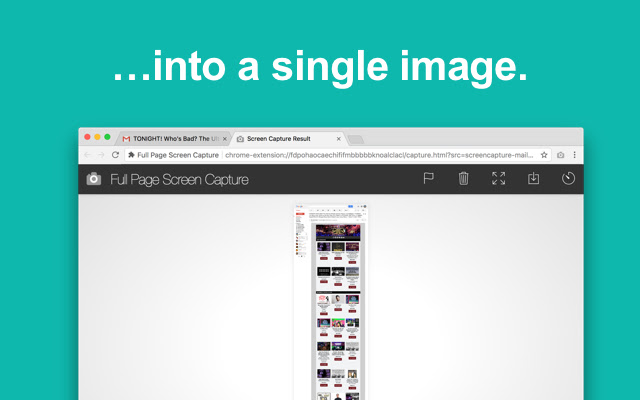
GoFullPage
One annoying aspect of debugging front-end styling issues is trying to communicate the problem clearly. This is especially difficult if different engineers are responsible for bug reporting and bug fixes. Because so much of styling is visual, testers rely heavily on taking screenshots of issues they want to discuss. GoFullPage solves the problem of taking multiple screenshots to capture a large element by allowing users to take a single snapshot of an entire webpage. It also doesn’t hurt that the extension is simple to use with just one click.
JavaScript Development Extensions
There’s really nothing quite like JavaScript development. It’s the main language used for front-end development, but it can be a lot to wrap your head around. It doesn’t follow many of the rules of other programming languages and it’s constantly evolving, taking on new features as developers build different frameworks to optimize different styles of coding.
As a result, JavaScript code can easily become unruly, and even the frameworks built to bring order to the chaos can be difficult to navigate.
That’s only become more pronounced as recent JavaScript frameworks emphasize state management, which is how different user interface components store information about users and actions. Applications have moved toward architectures that handle much of the decision-making on the front end rather than on the server. This creates a smoother user experience, but it also makes JavaScript code more complex and harder to untangle. Developers have to keep track of the state of the user experience at every point.
Thankfully, there are a few Chrome extensions developers can use when testing their JavaScript code to make following the flow of execution a little easier.
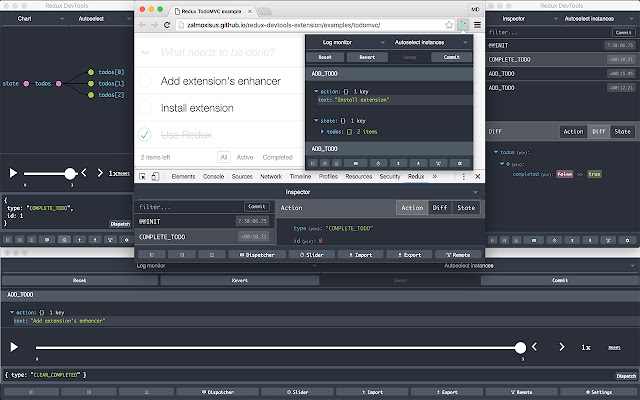
Redux DevTools
Redux is a JavaScript library that helps developers manage state in their code. Developers who rely on Redux can use this extension to easily see the state of their web application at every point in time. Redux DevTools displays the global state of the application and lets developers drill down to look into every object. There is also a corresponding actions list that tracks all actions that have occurred, so developers can see how actions and the state are interacting.
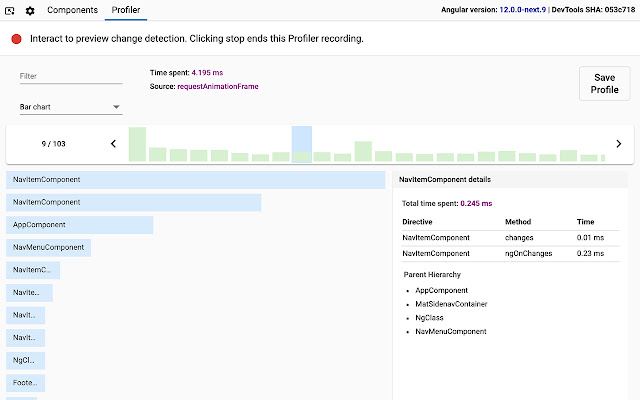
Angular DevTools
This extension was developed by Google, which also built the popular Angular framework for JavaScript development. Angular DevTools is easy to use and, crucially, doesn’t clutter up the browser window. Instead, it integrates into the existing Chrome DevTools as a new tab specifically for Angular. Using this tool, developers can inspect the states of elements and also examine performance and speed. The extension makes it much easier to follow the flow of the code and see whether everything is behaving as expected at each step.
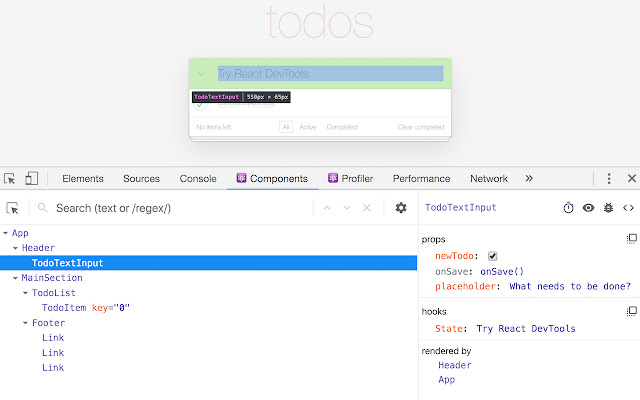
React Developer Tools
This Chrome extension is similar to the Angular DevTools extension, except it caters to the React JavaScript framework instead. There is a tree of React components, which developers can drill down into and see further properties of the components. It features actions like logging components to the console and tracking state changes as you interact with the website to help with debugging. Contained within two additional tabs in Chrome developer tools, the extension also avoids cluttering your desktop.
Back-End Developer Chrome Extensions
A browser may not seem like the most direct place to deal with the back-end development process, but back-end code often interacts with a browser to do things like exchange information and handle requests and responses.
Data can take a lot of different forms and can also be saved into many different places, both on the front end and the back end. When data isn’t formatted correctly or when input doesn’t contain the information expected, the code can perform incorrectly. But parsing through data can get messy. That’s why having a few useful Chrome extensions can make aspects of debugging these interactions easier to manage.
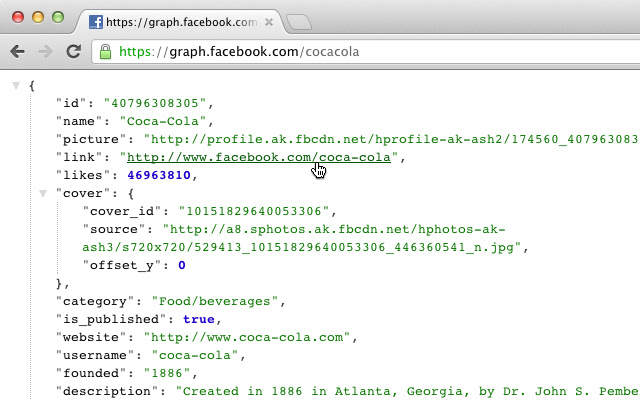
JSON Formatter
Often when you get JSON data, it is extremely hard to read. It may work fine with the code, but due to spacing issues, people will have a hard time making any sense of it. That can be a problem when there’s a bug and developers have to dive into JSON data to check the values. JSON Formatter allows developers to view JSON data directly in the browser in a readable format. It displays the JSON tree and allows users to drill down and collapse any components to make it easier to read.
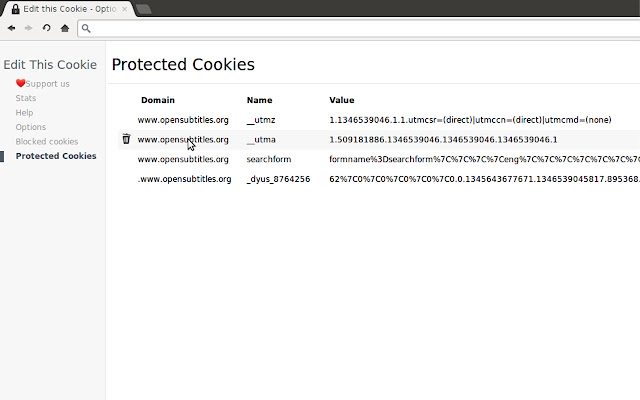
EditThisCookie
Anyone who has dealt with cookies knows how complicated they can be, and debugging issues with cookies can be doubly difficult because they store detailed information used for authentication. Even though Chrome DevTools has features that make it easy to view and delete cookies, it doesn’t offer many configurations.
EditThisCookie allows developers to edit the content of cookies, giving them more room to test different scenarios and check for logic holes in the code. It also makes it easy to add and create cookies, and includes features like blocking and importing or exporting cookies into files.
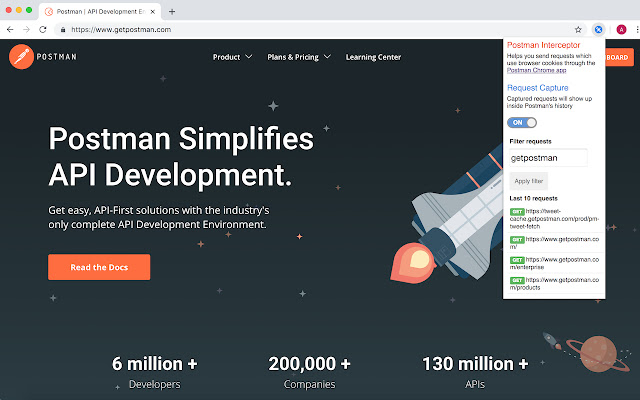
Postman Interceptor
Postman is a popular application for testing API calls, and this Chrome extension version makes the tool even easier to use. Developers can capture requests in the browser and observe how they’re formatted, then use the data to format their API calls and check that the data they send looks correct. Developers can also filter requests by type, such as only capturing POST or GET calls.
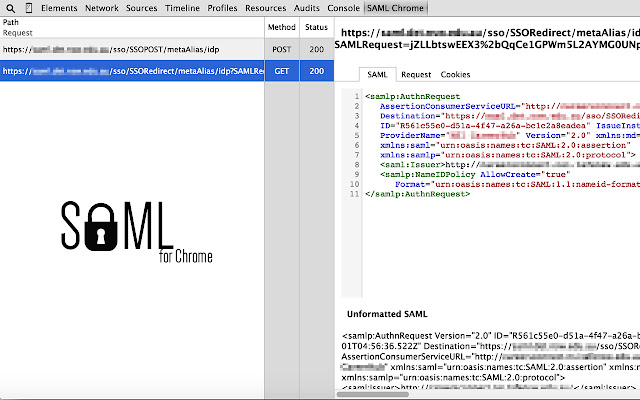
SAML Chrome Panel
As one of the major authentication standards, SAML can get pretty overwhelming, with several configurations and options for different types of authentication flows. This extension captures network traffic and highlights SAML requests and responses, then lets the developer drill down into the SAML messages. The tool can be used directly in the Chrome developer tools and has formatted SAML messages for easy viewing.
Performance Testing Chrome Extensions
If a mobile site takes over three seconds to load, most users navigate away. That’s why it’s so important for developers to do performance testing throughout the software development process and not just at the end when all the code has been written. Performance issues can sometimes indicate a larger architectural problem that requires work to redo. When those problems are caught early on, the fixes are a lot easier and quicker.
Developers can take advantage of Chrome extensions to help with performance testing in the browser. Some of these tools allow developers to get metrics on how well their websites perform compared to other website norms and alert them to specific concerns like slow load times, accessibility issues or security vulnerabilities. Other tools help developers understand how their website performs on search engine optimization.
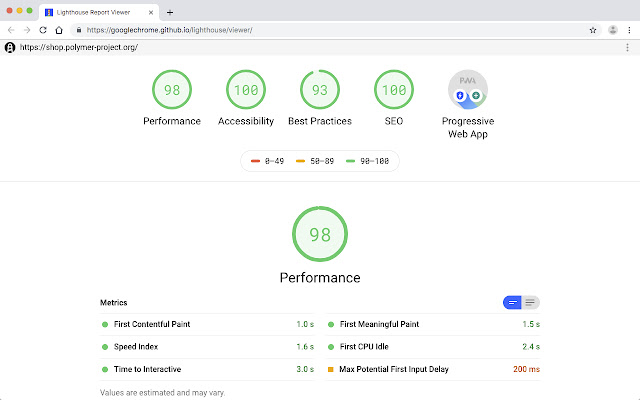
Lighthouse
Another Chrome extension developed by Google, Lighthouse helps developers audit their websites. It checks whether your application can be easily used as a progressive web app — an application that users can bookmark by creating a shortcut on their desktop or mobile homepage, much like a native app. The extension also gives feedback on accessibility concerns, like whether texts and background colors have good contrast. There’s also a suite of performance metrics, broken down into subcategories, like how long it takes for the first items to load on a page and how long it takes for the page to become interactive.
Alexa Traffic Rank
This extension is handy for developers who care a lot about SEO. It provides a short summary of the Amazon Alexa search ranking for any website and displays other facts about the website, like how many other sites link to your web page and examples of sites that have similar search traffic. It even provides developers with words that are closely associated with the search traffic for the given site. Developers can use the tool to improve their website’s SEO.
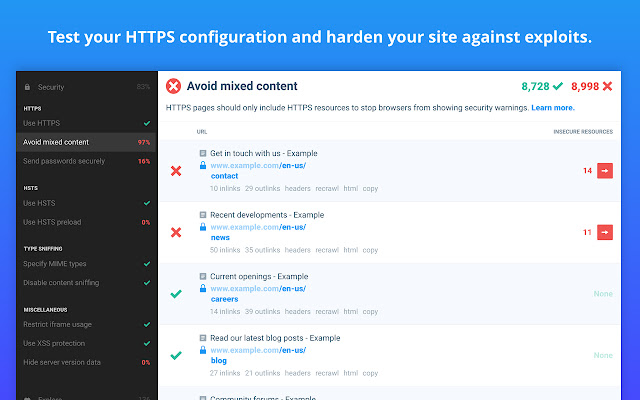
Checkbot
This extension tests SEO, performance and also website security. It gives feedback on changes that could improve metrics for each of the categories in a comprehensive report — for example, improving broken links and ALT tags on images and redesigning pages to display better on mobile in order to improve SEO rankings. When it comes to performance, the extension might suggest steps like using minification and cutting down on excessive API redirects. Checkbot also looks for security holes, like whether the site is using secure headers and whether insecure tools are included in the application.