Let’s say you work on an acquisition product with the goal of enrolling as many high-value users as possible. You partner with six separate stakeholder teams — each one super excited about their great ideas — who rely on you and your team of engineers to execute. You have to balance meeting their expectations with the other feature work that is important to you, the company-mandated strategy work, fixing pesky bugs and tech debt (the Achilles’ heel of any product team). There’s no way you can do it all ... so how will you decide?
What Is Opportunity Sizing?
How Will Opportunity Sizing Help Me?
It’s the best way to determine the KPI lift an idea could have, relative to all the other work in your backlog. It is not a financial report, a thesis or a promise of performance. Rather, it is a low-effort tool that you should use to quickly assess the impact an idea could have compared to all the other ideas your team could work on.
Additionally, having a “book” (a shared spreadsheet) of all feature ideas with associated opportunity sizes is a great way to show your stakeholders why you are prioritizing (or de-prioritizing) their big idea without bias. I used to share my book at every stakeholder meeting and say: “I do like Project Zeta, but because it will only impact 12 percent of our low-value user base, it’s fifth in line for engineering work. If there’s a way to expose this feature to more high-value users, we may be able to move it up in the roadmap.” This shows my stakeholders that I vetted their idea, gave it a place in line, and provided feedback for how it could be more impactful for users.
You can also share your book with your engineering team to demonstrate why they’re working on a certain project and what kind of an impact it could have. Opportunity sizing is really a win all the way around!
Where Do I Start?
The most important part of opportunity sizing is that you must have a single North Star metric that you use to assess all of your opportunities. If you assess one idea based on projected revenue and another on projected enrollments, you’ll have no way to compare the two. Consider the single metric that is most important to determining the success for your product.
The Most Common North Star Metrics
- Revenue
- Enrollments
- Activation
- Referrals
- Engagement
- User satisfaction (as determined by a feedback score or NPS)
For most e-commerce products, your North Star metric will be revenue per session. For most top-of-funnel products, your North Star metric is enrollments, activation or referrals. For most SaaS products, your North Star metric is engagement or user satisfaction. Whatever your North Star metric is, make sure you can justify it to your stakeholders and leadership. It is crucial to gain consensus among this group regarding what success means for your product so that everyone is aligned with the opportunity sizing.
I Have My North Star Metric. What’s Next?
Start by listing out the assumptions for each idea in your backlog. It should follow this template: By [describe the project idea], [describe what will happen], leading to [describe the effect on your North Star metric].
Here are some examples:
- By placing a card on the homepage carousel, a significant number of users will be interested in learning about the loyalty program, leading to more enrollments.
- By adding a mini-cart to the sidebar, we’ll make it easier for users to see what is in their cart without interrupting their TOF shopping, leading to more orders per session.
- By partnering with a third-party data enrichment API, we’ll make the arduous four-step onboarding process easier for our users, leading to an increase in our average session satisfaction score.
Which Data Should I Use, and How Do I Find It?
Depending on your company’s resources, this can be tricky. Hopefully, you have access to on-demand analytics or can requisition an analyst’s time to help you track down some of these numbers. If you don’t have great access to data, don’t fret! Remember that the nature of opportunity sizing is directional.
Do your best to nail down a few baseline numbers, which could be: monthly active users, sessions, revenue, clicks, etc. If these numbers are accurate, you can do a lot from here. If you don’t have access to an on-demand analytics tool, you’ll have to get creative with where you find your data. When I worked on a subscription product and we didn’t have on-site tracking, I had to rely on my friends in accounting to give me access to financial reporting tools just so I could find my product’s order-level data. (Thanks again, Lex!)
Assumption Modeling: Get Comfortable With Uncertainty
This is where most product managers struggle: You’re going to have to make some approximations. Remember that the purpose of opportunity sizing is to estimate the impact a new project could have on your North Star metric — by definition, there’s some guessing involved. To hedge against uncertainty, it’s important to use relevant proxies to make assumptions within your model.
Here are some ways to think about selecting proxies:
- I don’t know how my card on the carousel will perform, but I do know from other teams who have used this carousel that their click-through rate is typically 3 percent.
- I don’t know how many users will decide to engage with this new feature, but we released a similar feature last quarter that targeted the same customer base and saw enrollments of 20 percent.
- I don’t know how much site traffic will increase, but historically we’ve seen 2.5 percent increases in traffic every month for the last year.
Let’s return to our first example: “By placing a card on the homepage carousel, more users will be interested in learning about the loyalty program, leading to more enrollments.”
First, we start by collecting our known (or historic) data:
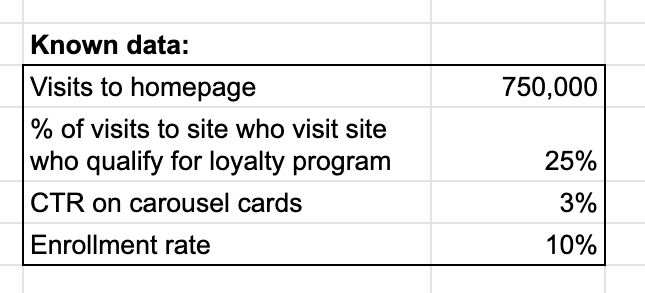
Now, we can start to build our model:
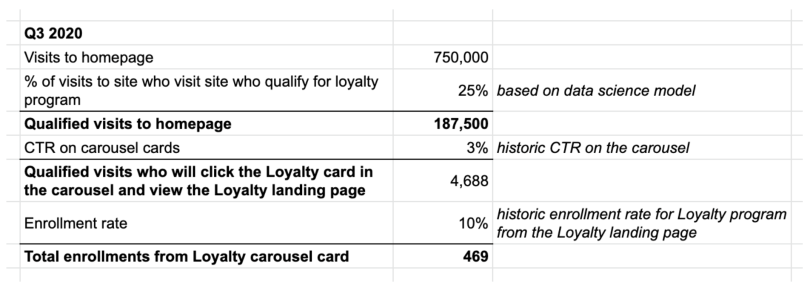
Based on the data we already have, we can estimate that we could have gained 469 enrollments if we had run a loyalty card in the carousel in Q3. But how do we use this information to predict the future? Let’s say that your homepage has historically had a quarterly growth rate of 5 percent, and you anticipate the user mix of qualified loyalty users increasing up to 30 percent by the end of next year due to better advertising strategies. How would that change the forecast?
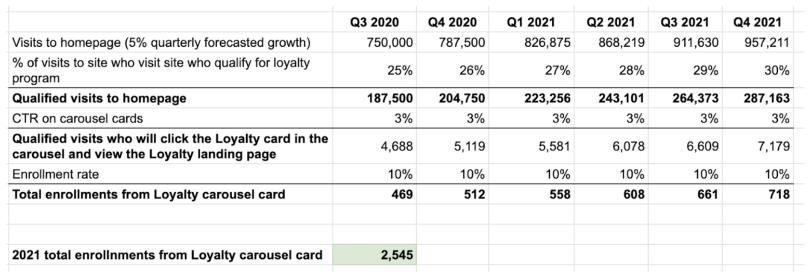
There you have it! Based on historical data and relevant forecasts, you can predict that if you build the new loyalty carousel card in Q4 2020, then it will bring in 2,545 new users in 2021. Will you prioritize the loyalty carousel card in Q4? What about all the other ideas you have in your backlog? You should use this opportunity sizing to quickly assess all of them.
The Takeaway
As product managers, we must mercilessly prioritize only the most high-impact and high-value work so we can deliver the best experience to our users. Without a data-driven method of prioritization, you are inviting anyone with an opinion to hijack your roadmap. In my experience of working on nine product teams at three companies, opportunity sizing is the best way to rally all of your stakeholders around one common goal, communicate to leadership what your projected impact will be for the quarter — and have a prioritized queue of work at all times that you can rely on.