In statistical analysis, a parametric test is a type of test that assumes the data being tested follows a known distribution, such as a normal distribution, binomial distribution or other distribution form. A non-parametric test, on the other hand, does not assume the data being tested follows a specified distribution, and is often used when the data does not meet the parametric assumptions of the population sample.
Parametric vs. Non-Parametric Tests
A parametric test makes assumptions about a population’s parameters, and a non-parametric test does not assume anything about the underlying distribution.
This article will share some basics about parametric and non-parametric statistical tests and when/where to use them.
What Is a Parametric Test?
A parametric test makes assumptions about the following population’s parameters:
- Normality : Data in each group should be normally distributed.
- Independence : Data in each group should be sampled randomly and independently.
- No outliers : No extreme outliers in the data.
- Equal Variance : Data in each group should have approximately equal variance.
If possible, we should use a parametric test when conducting statistical analysis.
Types of Parametric Tests
Common types of parametric tests include:
- T-test
- Z-test
- ANOVA (analysis of variance)
- Pearson correlation
- Linear regression
What Is a Non-Parametric Test?
A non-parametric test (sometimes referred to as a “distribution-free test”) does not assume anything about the underlying distribution (for example, that the data comes from a normal, parametric distribution). Non-parametric tests tend to be used when the assumptions of parametric tests are clearly violated, and provide a flexible testing option for skewed or non-normally distributed data.
At the same time, non-parametric tests can still have other assumptions that must be met, including that data in all groups must have the same dispersion or spread.
Types of Non-Parametric Tests
Common types of non-parametric tests include:
- Wilcoxon signed-rank test
- Mann-Whitney U test (or Wilcoxon rank-sum test)
- Kruskal-Wallis test
- Friedman test
- Chi-square test
When to Use Parametric vs. Non-Parametric Tests
Choosing between using a parametric versus non-parametric test for statistical analysis often depends on normality, sample size and amount of skewness/outliers in the data.
Use a parametric test for:
- Normally distributed data
- Data with homogeneity of variance
- Data with independent observations
- Interval or ratio data
Use a non-parametric test for:
- Non-normally distributed data
- Small sample sizes
- Data with outliers
- Nominal, ordinal or interval data
How to Test for Normality for Parametric vs. Non-Parametric Tests
The following methods can be used to check for data normality, and help determine whether to use a parametric test (for normally distributed data) or a non-parametric test (for a non-normal or unspecified distribution):
Q-Q (Quantile-Quantile) Plot
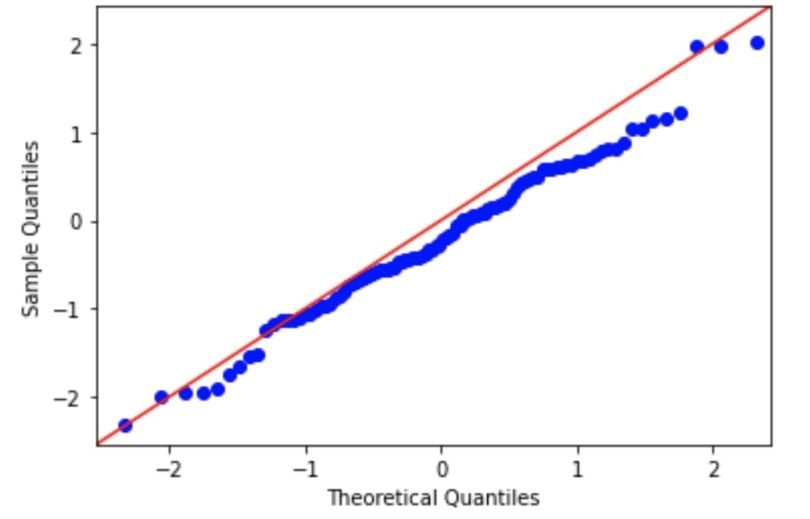
We can assess normality visually using a Q-Q (quantile-quantile) plot. In these plots, the observed data is plotted against the expected quantile of a normal distribution. If the data are normal, it will appear as a straight line in a Q-Q plot.
A demo code in Python is seen here, where a random normal distribution has been created and will be assessed using a Q-Q plot.
import numpy as np
import statsmodels.api as statmod
import matplotlib.pyplot as plt
#create dataset with 100 values that follow a normal distribution
data = np.random.normal(0,1,100)
#create Q-Q plot with 45-degree line added to plot
fig = statmod.qqplot(data, line='45')
plt.show()
Based on the normality of this data, we would likely use a parametric test.
Shapiro-Wilk Test or Kolmogorov-Smirnov Test
The null hypothesis of both a Shapiro-Wilk test and Kolmogorov-Smirnov tests is that the sample was sampled from a normal (or Gaussian) distribution. Therefore, if the p-value is significant, then the assumption of normality has been violated and the alternate hypothesis that the data must be non-normal is accepted as true.
How to Choose Parametric vs. Non-Parametric Tests for Interval Data
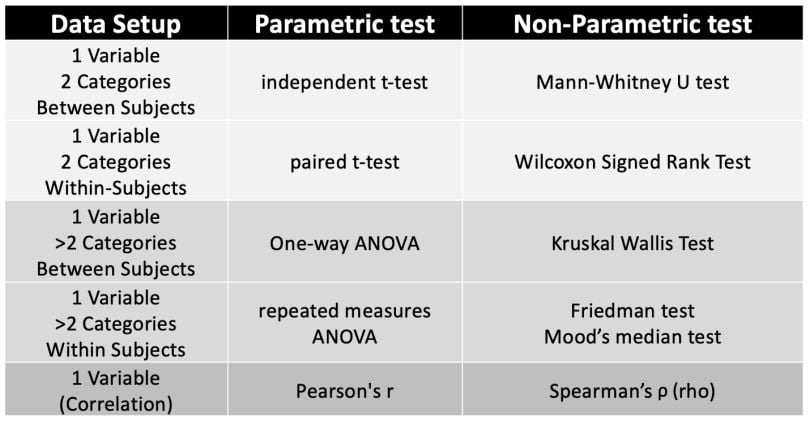
Interval data can be used for both parametric and non-parametric tests, so when dealing with interval data in statistical analysis, you can refer to this table to determine what test to use. The following tests are chosen to be conducted based on the number of data variables, groups being compared and whether the data is intended for within-subjects design (where each participant experiences every experimental condition/all experimental conditions) or between-subjects design (where each participant experiences only one experimental condition).

Advantages and Disadvantages of Parametric vs. Non-Parametric Tests
Advantages and Disadvantages of Parametric Tests
Parametric tests come with advantages and disadvantages. These include the following:
Advantages of Parametric Tests
- Effective for normally distributed data
- Can be more statistically powerful and more likely to detect a statistical effect compared to non-parametric tests
- Can be more accurate and provide more precise results when assumptions are met, in comparison to non-parametric tests.
- Can be used for continuous (interval or ratio) data.
- Can still provide reliable results if data is non-normal or skewed, based on certain requirements for the test used.
Disadvantages of Parametric Tests
- Sensitive to parametric assumption violations, which can lead to less reliable results.
- Sensitive to outliers and skewed data.
- Less effective when using the median as a measure of central tendency.
- May not capture complex data relationships, as it works best on linear, normal data.
Advantages and Disadvantages of Non-Parametric Tests
Non-parametric tests have several advantages and disadvantages, including the following:
Advantages of Non-Parametric Tests
- Effective for non-normal data and small sample sizes.
- More statistical power when assumptions of parametric tests are violated.
- Can be more flexible than parametric tests, since assumption of normality does not apply.
- Can be used for categorical (ordinal and nominal) data or some continuous (interval) data.
- Can be used with data that has outliers.
Disadvantages of Non-Parametric Tests
- Less powerful than parametric tests if parametric assumptions are met.
- Can use less information during analysis than parametric tests, leading to less statistically significant results.
- Less effective when using the mean as a measure of central tendency.
Frequently Asked Questions
What's the difference between parametric and non-parametric?
A parametric test assumes that the data being tested follows a known distribution (such as a normal distribution) and tends to rely on the mean as a measure of central tendency. A non-parametric test does not assume that data follows any specific distribution, and tends to rely on the median as a measure of central tendency.
How do you know if data is parametric or non-parametric?
Data used for parametric tests is often assumed to be normally distributed, have equal variances between groups, have observations that are independent from each other and be continuous. Meanwhile, data used for non-parametric tests don’t follow a specific distribution, and is often assumed to be categorical or sometimes continuous (for interval data).
What is an example of non-parametric data?
Nominal and ordinal data are examples of non-parametric data, including nominal variables like eye color and blood type, or ordinal variables like educational level or level of customer satisfaction.


