When I write about a library or a new concept, I typically like to showcase how it works through concrete examples. The sources I use for data sets in my articles vary widely. Sometimes I create simple toy data sets, while other times I go with the established data set sites like Kaggle and Google search. However, every time I need to showcase a concept, I have to go through the laborious work of copying the data from the source, saving it to my system, and finally using it in my development environment. Luckily, there is a built-in method to create a dataframe in Pandas that can dramatically speed up your workflow.
What Is the pandas.read_clipboard() Function?
The read_clipboard() method creates a DataFrame in Pandas from data copied to the clipboard. It reads text from the clipboard and passes it to read_csv(), which then returns a parsed DataFrame object.
This method, aptly named read_clipboard is an absolute savior when you want to try out some new function or library quickly. Here’s how to use it.
How to Convert Clipboard Data to a DataFrame in Pandas
The read_clipboard() method of Pandas creates a DataFrame from data copied to the clipboard. It reads text from the clipboard and passes it to read_csv(), which then returns a parsed DataFrame object.
Syntax
pandas.read_clipboard(sep='\\s+', **kwargs)If you’ve worked with read_csv(), you’ll find read_clipboard() just as intuitive for creating a dataframe in pandas from clipboard data. The only difference is that the source of data in the latter comes from the clipboard buffer instead of a CSV file.
Usage
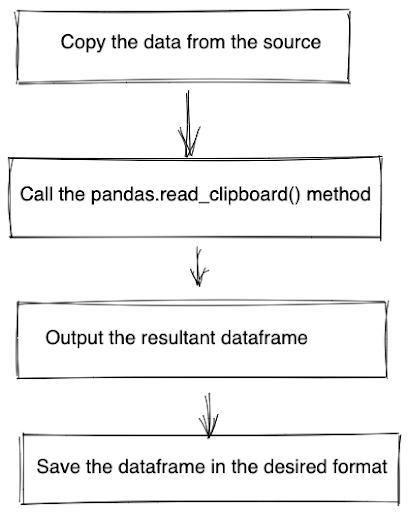
Let’s now look at various ways of using this method. The main steps involved are:

1. Copying Data from Excel Files
We’ll begin by copying some data sets from an Excel file. This is the most common scenario you’ll encounter.
Now you’ve copied the data onto the clipboard. Next, we’ll navigate to a Jupyter Notebook (or any IDE) instance and type in the following code snippet:
import pandas as pd
df = pd.read_clipboard()
df

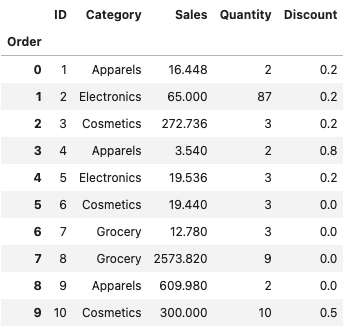
The copied data set gets passed into the variable DataFrame and is now available in your environment. Here’s a demonstration of the process.
2. Copying Data From CSV Files
If you have a CSV file, the steps remain the same. You will only need to make certain changes in the parameters of the function. Consider the following CSV data:
,Order ID,Category,Sales,Quantity,Discount
0,1,Apparels,16.448,2,0.2
1,2,Electronics,65.0,87,0.2
2,3,Cosmetics,272.736,3,0.2
3,4,Apparels,3.54,2,0.8
4,5,Electronics,19.536,3,0.2
5,6,Cosmetics,19.44,3,0.0
6,7,Grocery,12.78,3,0.0
7,8,Grocery,2573.82,9,0.0
8,9,Apparels,609.98,2,0.0
9,10,Cosmetics,300.0,10,0.5
Copy the above data and run the code below.
df = pd.read_clipboard(
  sep=",",
  header="infer",
  index_col=0,
  names=["Order", "ID", "Category", "Sales", "Quantity", "Discount"],
)
df

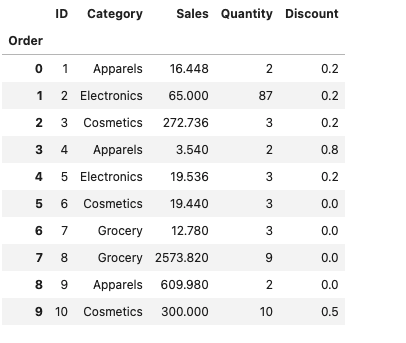
We get the same DataFrame as in step one. The only difference is that we had to pass in the name of the columns and information about the header and index column.
3. Copying Data From Webpages
You can also copy the data from any source, including a web page, as long as it’s structured in the form of a DataFrame. Here’s an example of copying data from StackOverflow and importing it into a DataFrame.
4. Saving the Data
We can use the clipboard data to save the data set for future use in the desired format.
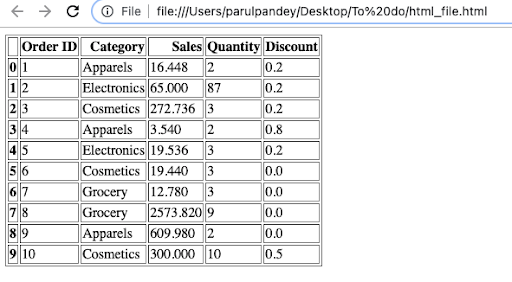
df.to_csv('data.csv')You can also save the data in HTML format to display the data as HTML tables.
df.to_html('data.html')
Now that you’ve learned about the read_clipboard method, go try it out.
Frequently Asked Questions
What is a Dataframe in pandas?
A DataFrame in Pandas is a two-dimensional, tabular data structure similar to a spreadsheet or SQL table used for storing and analyzing data in Python.
What is the function of Dataframe in Pandas?
A dataframe organizes data into rows and columns, with each column holding a different data type. Dataframes make it easy to manipulate, visualize or analyze data within Python.


