

If you’ve ever been to the beach, especially the beaches of the coastal U.S. southeast, you might be familiar with the terrifying feeling of seeing something globular and undulating in a fast-approaching wave during your dip in the ocean. Jellyfish pervade the local waters, and doubly so during the months when ocean swimming is best. For a creature without a brain, this certainly seems well-coordinated for maximal inconvenience. Besides being little more than hunks of floating ooze, some species of jellyfish also boast stingers, and a subset of these species can produce stings that are potentially life-threatening.
Most stings, though, however unpleasant, are not life-threatening. For this reason, they are not recorded as medical statistics. So, if researchers wanted to collect information on how much of the U.S. population has been stung by jellyfish, the best option would be to ask a sample of people and extrapolate the findings population-wide.
In this case, if researchers surveyed people nationwide and simply aggregated their results, however, those results would be misleading. Most of the U.S. is landlocked. Surveying individuals in states with no coastline inherently involves a different probability of being stung by a jellyfish than individuals who live near a beach. A nationwide, random survey of Americans would tend to overrepresent individuals with higher likelihoods of never being stung.
What Is Stratified Sampling?
What Is Stratified Sampling?
In situations like this, stratification produces sharper, more precise estimates than other methods. To stratify means to subdivide a population into a collection of non-overlapping groups along some metric. Individuals within these subgroups — or “strata” — can then be randomly surveyed. Lastly, researchers aggregate survey results pertaining to each subgroup with statistical weights built from the information researchers used to subdivide the individual strata.
Take, for example, the hapless researchers who forgot to tailor their jellyfish-sting survey to the specific parts of the U.S. most likely to contain jellyfish (outside of an aquarium setting). A potential option these researchers could use to stratify their nationwide population is by state, and then weight their aggregated statewide proportion of stings by how many miles of coastline each state has. Doing so would upweight individuals’ answers to the question “Have you ever been stung by a jellyfish?” if they live in states near which jellyfish are also more likely to reside.
This example assumes, of course, that individuals who have been stung by a jellyfish and reside in Nebraska, say, got stung in Nebraska. Such an outcome is unlikely, however, unless the person in question were wildly unlucky or given to swimming through aquarium tanks. Clearly, stratification is not immune to bad assumptions!
Stratified Sampling: An Example
Another illustration of stratification that potentially speaks to a wider swath of the U.S. population concerns another type of pest, this one closer to home. The U.S. Census Bureau reports that nearly 15 million American households reported seeing rodents in their dwellings last year. Rats and mice, while arguably more adorable than stinging sea jellies, are Americans’ most familiar uninvited house guests. But how many rodents are there in a given house? It’s tough to say, given that rodents typically avoid making their presence known to homeowners. Stratified sampling can help solve this dilemma.
As of 2020, the median size of U.S. houses is 2,261 square feet. Assume a just-above-median, 2,400-square-foot house has five rooms, each with a different square-foot area. Rats can be in any of these rooms. The homeowners want to know how many total rats there are in the house. So, they purchase traps to set in each of the five rooms to determine the likely total size of their rat infestation. Since larger rooms provide both more room for rats to live in but also more area for rats to evade traps, the homeowners decide to stratify the total area of their house by room size.
The table below contains room size information, along with the results of the “survey” of traps (it should be pointed out that these owners are sampling rodents without replacing them, due to the lethality of trapping).
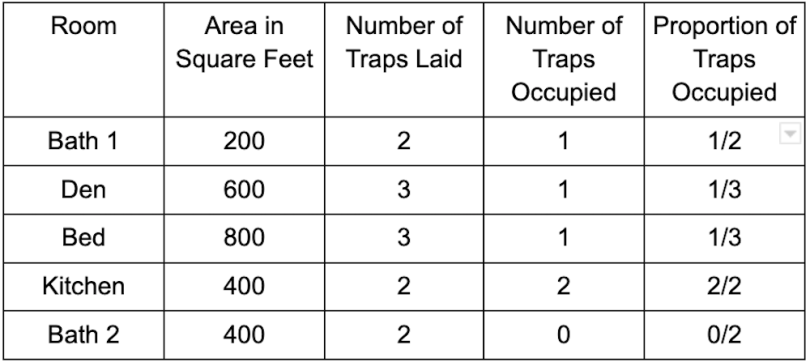
The homeowners, in their haste to estimate the scale of their rodent infestation, quickly take an average of the five proportions: (1/5)(1/2) + (1/5)(1/3) + (1/5)(1/3) + (1/5)(2/2) + (1/5)(0/2) = 13/30 or about 43 percent of traps occupied. Multiplying this proportion by the total traps set gives an estimated total size of the rat population across all rooms: (.43)(12) = 5.2 rats.
“But wait,” says one of the homeowners, “didn’t we say that bigger rooms are less likely to have occupied traps? Shouldn’t we account for this by weighting our estimate by room size?” The other homeowners agree. They re-compute their estimate, this time weighting by the proportions of room sizes to total house size: (200/2,400)(1/2) + (600/2,400)(1/3) + (800/2,400)(1/3) + (400/2,400)(2/2) + (400/2,400)(0/2) = 40 percent of traps occupied. This results in a rat population estimate of (.40)(12) = 4.8 rats.
These estimated totals seem close, but are not quite as proximate as they initially appear. A half-rat discrepancy might not make a lot of difference for a 2,400 square-foot home, but imagine estimating total rats across several warehouses or a fleet of cruise ships or a large hospital system. In these cases, the estimated total could be dozens or hundreds of rats off simply because researchers failed to account for relevant information at subpopulation levels.
When Should You Use Stratified Sampling?
So, when should researchers employ stratification in their sampling process? In the second edition of her textbook, Sampling: Design and Analysis, the statistician Sharon Lohr lists four primary reasons for stratification.
4 Reasons for Stratified Sampling
- To prevent taking a bad sample.
- Knowledge of subgroups improves estimate precision.
- Stratification makes research easier and cheaper.
- Stratification reduces noise in a sample.
First, researchers should stratify when they want to shield themselves from taking a horrible sample. As Lohr puts it, when taking a simple random sample (i.e. taking a sample of everyone in a population without accounting for subgroups) of size 100 from a population of 2,000 males and females divided evenly, it is possible that the simple random sample includes no or few members of one sex. Knowledge of the proportionate breakdown between sexes in this population results in researchers randomly sampling 50 males and 50 females. Stratification by sex precludes a non-representative sample that is made up of no or few members of one of the sexes (the keen eye will note that the homeowners set their traps this way — larger rooms got more traps than smaller rooms).
Knowledge about subgroups can improve estimate precision, which is the second reason Lohr gives in favor of stratification. In their 1992 work on gender and engineering careers, Judith Samsom McIlwee and J. Gregg Robinson sought to measure workplace outcomes for male and female mechanical and electrical engineering graduates. At the time the authors sampled engineering graduates, however, there were many more men than women in these fields. McIlwee and Robinson used this information to oversample (sampling the under-represented group more than the over-represented group) women to ensure that the precisions of estimated outcomes were the same across genders. Without stratifying and oversampling, estimated outcomes for female engineers would have been more uncertain than estimates for their male counterparts.
A third reason to employ stratification techniques is that they might make surveying easier or cheaper. Researchers can tailor survey types by subgroups to drive down administrative costs. For instance, internet-based surveys are more affordable for large corporations than traditional phone screening or site visits. Researchers could then focus more effort on contacting smaller businesses via telephone or visitation to collect information. Both of these techniques are more expensive than internet-based surveying but can better capture under-represented strata. By targeting specific under-represented subgroups, stratification can result in higher precision for the same cost as larger, simple random surveys or the same precision at lower costs.
This leads directly to the last reason researchers might consider stratification: It frequently yields less noisy estimates of population means and totals. It’s almost always the case that members of the same subgroup of a population are more similar than a random sample of members of all subgroups. Accounting for these within-stratum similarities and then pooling information across strata typically yields estimates with lower standard errors than randomly surveying an identical number of individuals population-wide.
Knowledge of how to construct strata can inject more information about individual responses into aggregated measures than simple random surveying. Thus, correctly identifying appropriate strata is a low-cost method by which to improve statistical estimates of populations. Assuming researchers choose strata that contain even small amounts of relevant information pertaining to all members of population subgroups, stratification proves a crucial tool to sharpen empirical estimation and, thereby, produce more accurate inferences; it’s a lot more honey for a little more sting.


