The Kruskal-Wallis test is a non-parametric method for testing whether samples originate from the same distribution. “Non-parametric” means that the test does not assume your data follows a normal distribution. Instead, the Kruskal-Wallis test helps you determine if there are significant differences between two or more independent groups based on the ranks of their scores. This is different from an ANOVA (Analysis of Variance) test, which assumes that the data is normally distributed and helps assess statistical significance to determine if the differences in scores between groups are meaningful or just due to random chance.
What Is the Kruskal-Wallis Test?
The Kruskal-Wallis test is a non-parametric method for testing whether samples originate from the same distribution. The test does not assume your data follows a normal distribution. It helps you determine if there are significant differences between two or more independent groups based on the ranks of their scores.
To understand this better, you need to grasp the concept of the p-value. The p-value is a number that helps you understand if your results are statistically significant. In simple terms, it tells you whether the differences you see in your data are likely real or if they could have happened by random chance. If the p-value is very small (usually less than 0.05), it means that the differences you observe are probably real and not just due to random luck. If it’s larger, it means the differences might just be due to chance, and there might not be anything special going on.
When Should You Use the Kruskal-Wallis Test?
The Kruskal-Wallis test is particularly useful when you need to compare three or more independent groups of numbers. This test is an excellent choice when the assumptions of ANOVA, particularly that the data is normally distributed, are not met. This is especially true when the data are not normally distributed or when the sample sizes are small.
Steps to the Kruskal-Wallis With Example
Let’s consider a large retail chain that wants to measure customer satisfaction across different branches. They ask customers to rank their satisfaction on a scale from one to five. Here’s how they can use the Kruskal-Wallis test:
1. Collect Data
We have customer satisfaction data from three branches (A, B, and C) of a retail store. Customers ranked their satisfaction on a scale of one to 10.
- Branch A: 7, 8, 9, 4, 6
- Branch B: 6, 5, 9, 7, 5
- Branch C: 8, 6, 5, 8, 7
2. Rank the Data
Combine all scores from every branch and rank them from lowest to highest.
Combined Data: 4, 5, 5, 5, 6, 6, 6, 7, 7, 7, 8, 8, 8, 9, 9
We would rank the data like this:
- 4 -> 1
- 5 -> 3 (Average rank for tied values)
- 5 -> 3
- 5 -> 3
- 6 -> 6 (Average rank for tied values)
- 6 -> 6
- 6 -> 6
- 7 -> 9 (Average rank for tied values)
- 7 -> 9
- 7 -> 9
- 8 -> 12 (Average rank for tied values)
- 8 -> 12
- 8 -> 12
- 9 -> 14.5 (average rank for tied values)
- 9 -> 14.5
Now, assign these ranks back to the original scores for each branch.
- Branch A Ranks: 9, 12, 14.5, 1, 6
- Branch B Ranks: 6, 3, 14.5, 9, 3
- Branch C Ranks: 12, 6, 3, 12, 9
3. Calculate the Rank Sums
Add up the ranks for each branch.
- Sum of Ranks (Branch A): 9 + 12 + 14.5 + 1 + 6 = 42.5
- Sum of Ranks (Branch B): 6 + 3 + 14.5 + 9 + 3 = 35.5
- Sum of Ranks (Branch C): 12 + 6 + 3 + 12 + 9 = 42
4. Compute the Test Statistic
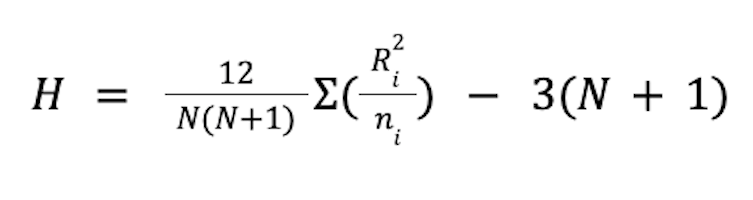
Where:
- N = total number of observations. Here, that is 15.
- Ri = sum of ranks for each group
- ni = number of observations in each group. Here, that is five for each branch
Completing the formula, we see that H = 0.305.
5. Compare With Critical Value
Look up the critical value for the Kruskal-Wallis test based on the number of branches and compare it with your test statistic. For
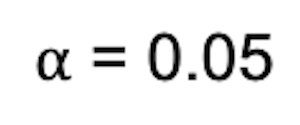
and
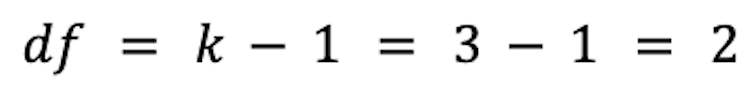
We find the critical value from the chi-square distribution table is 5.991. Since 0.305 < 5.991, we fail to reject the null hypothesis.
Interpreting the Kruskal-Wallis Test Results
After you calculate the test statistic, you need to understand what it means. If the test statistic is larger than the critical value, then there are significant differences in customer satisfaction between the branches. Some branches are making customers happier than others.
If the test statistic is smaller than the critical value, then there are no significant differences in customer satisfaction. All branches are performing similarly in terms of customer satisfaction.
Kruskal-Wallis Test Assumptions
When using the Kruskal-Wallis test, there are some assumptions to keep in mind.
Independent Groups
Each group (or branch) should be different from the others. For example, customers from one branch shouldn’t also be counted at another branch.
Ordinal Data
The satisfaction scores are ranks, not exact numbers. This means customers might rank their satisfaction as first, second, third, and so on.
Similar Shapes of Distributions
The distribution of ranks should be similar across all groups. Even though the data doesn’t need to be normally distributed, the shapes of the rank distributions should look somewhat alike.
Using the Kruskal-Wallis Test
The Kruskal-Wallis test is a useful tool for comparing groups when the data doesn’t fit the usual patterns required for other tests like ANOVA. In our example here, we saw how, by ranking customer satisfaction and following the steps to calculate the test statistic, you can determine if there are differences between the branches. This helps the retail store understand how different branches are performing and where they might need to make improvements.
The Kruskal-Wallis test is an essential method for analyzing non-normally distributed data and making meaningful comparisons between multiple groups, especially in fields like customer satisfaction surveys, medical research and educational studies.
Frequently Asked Questions
When should you use the Kruskal-Wallis test?
The Kruskal-Wallis test is particularly useful when you need to compare three or more independent groups of numbers. This test is an excellent choice when the assumptions of ANOVA (Analysis of Variance), particularly normally distributed data, are not met. It is especially useful when the data are not normally distributed or when the sample sizes are small.
What are the assumptions of the Kruskal-Wallis test?
- Independent Groups: Each group (or branch) should be different from the others.
- Ordinal Data: The satisfaction scores are ranks, not exact numbers. This means ranks like first, second, third and so on.
- Similar Shapes of Distributions: The distribution of ranks should be similar across all groups. Even though the data doesn’t need to be normally distributed, the shapes of the rank distributions should look somewhat alike.