Data scientists predict the future. To do that, we develop models based on existing data sets, then use the models to predict what will occur in fairly similar situations. In other words, data science is a mathematical way of learning from what’s already occurred and using that information to make optimal decisions.
Of course, a model’s predictions are only as good as the model itself. In order for a model to return accurate predictions it must match the available data set. If the model doesn’t match the data set, then you can be sure that it won’t return an accurate prediction. So it’s important that you know how to identify poorly fit and well fit models. Let’s talk about how to do that.
Model Fit: How to Identify Underfit and Overfit Models
- Underfit models fail to closely match the available data points and don’t capture the general shape of the available data set.
- Overfit models match the available data extremely well — maybe too well — and show trends in the prediction that don’t exist in the available data.
Underfit and Overfit Models
There are generally two terms used to describe how models can fail to match an existing data set. They are:
Underfit
An underfit model isn’t complex enough to match the data set. It does a poor job of matching the available data because it can’t replicate all the observed changes. For example, if somebody estimates tax payments based on a flat tax assumption in a country with a progressive tax structure, that model is underfit. The percentage of tax somebody pays varies with their income, but the model assumes the same tax rate for each dollar and every person. In other words, the model is oversimplified.
Overfit
An overfit model is one that’s too complex for the available data. The high complexity allows the model to have too many changes for the data set, creating curves and variations that don’t actually exist. The model will often do an extremely good job of matching the available data, but be unable to accurately predict what occurs between the data points. Essentially, we have the inverse of an underfit model; a model based on the assumption of a progressive tax structure might match each person’s tax payment correctly, but it’s entirely too complex to model a flat tax structure.
Figure 1 provides a visual representation of these concepts. The series, represented as circles called “Available Data” shows theoretical income tax receipts with a progressive tax structure. The assumed progressive tax structure is pretty simple. The government taxes the first 10 thousand dollars at 10 percent, the second ten thousand at 20 percent, the third 10 thousand at 30 percent, and so on. We add a bit of randomness to replicate the fact that different homes take different deductions (in the US tax code).
The second series, represented with the blue line, called “Underfit” assumes a flat tax structure.
The third data series, called “Overfit,” is a 20th order model assuming an extremely complex progressive tax structure.
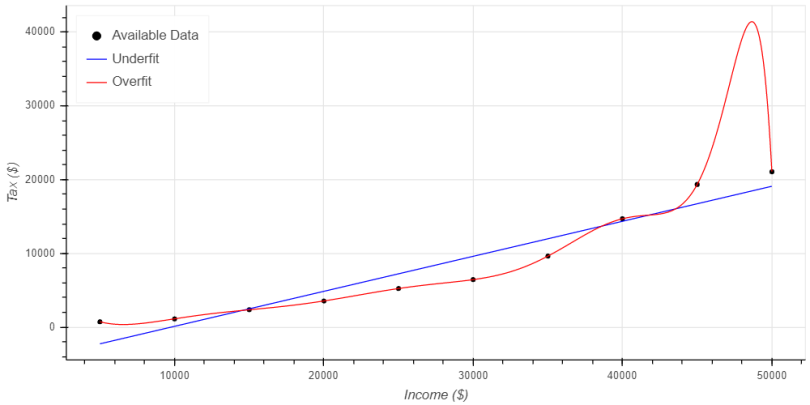
The blue line, representing the underfit model, clearly fits the data poorly. There are only three points where the model is close to matching the data, either overpredicting or underpredicting the rest of the data points. It also doesn’t follow the shape of the data, thereby failing to capture the fact that tax rates increase as income increases, yielding an increasing slope in the data set.
The red line represents the overfit model and matches the available data almost perfectly. The model captured the shape of the data nicely as well…until incomes exceed $40,000 per year.
From $40,000 to $44,000 per year the model predicts essentially no change in tax due, then it suddenly increases dramatically from $44,000 to $45,000 per year. Since the real trend is gradually increasing taxes with increasing income, the flat shape of the model from $40,000 to $44,000 would cause the model to underpredict reality.
The real issue arises in the $45,000 to $50,000 range. The model predicts an increase of $22,000 per year in taxes when income rises from $45,000 to $49,000 with no data whatsoever to indicate that this is accurate. Then, from $49,000 to $50,000 per year the anticipated taxes decrease by $20,000 and return to matching the data. The model predicts trends that don’t exist in the data — ones that can’t predict tax values between the available data points.
What Does a Well Fit Model Look Like?
A well fit model should match the available data closely (perfectly would be wonderful, but highly unlikely), while also closely matching the general shape of the data. Figure 2 provides an example of a well fit model. It presents the same general plot as Figure 1, and the black circles still represent the tax receipts available in our hypothetical data set. The green line represents a third order model fit to the data.

Note how the green line, representing the third order regression, doesn’t perfectly match the available data. This is unfortunate, but a realistic expectation since there’s a bit of randomness included in the data set. However, the model does match every single data point pretty closely. The exponential growth in the curve also matches the shape of the available data. The model’s neither entirely too simple for the data set, like the underfit model from Figure 1, nor is it entirely too complex for the available data, as we saw with the overfit model. Instead, each prediction from the model falls between the high and low points in the data set. Because it closely matches the shape of the data and doesn’t add inaccurate trends, we can trust this model to provide reasonable predictions and insights.
Where Can I Learn More?
There are a number of different sources where you can learn more. My current favorite source for additional discussion is Data Science from Scratch by Joel Grus. I’ve also provided a much more detailed description of model development and validation. For those dedicated to investing a lot of time to learning more, Coursera offers an excellent course on machine learning.