

What is data-driven design? One way to answer that question is to consider another: To hamburger or not to hamburger?
The so-called hamburger menu — the once-ubiquitous, three-horizontal-bar navigational element that resembles its namesake — remains one of the more controversial UX options. Uber still uses it. Spotify, on the other hand, cut it from its design diet back in 2016.
What is Data-Driven Design?
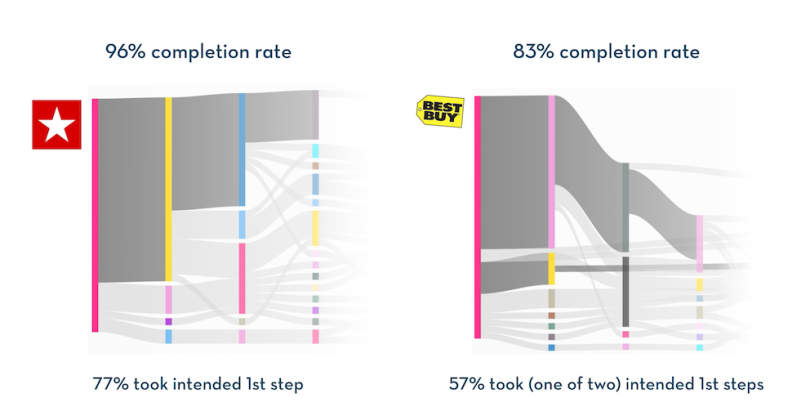
In 2017, researchers from the University of Illinois–Urbana-Champaign and Google had a group of users perform the same task — find the address of the store closest to a certain zip code — on two different apps. One app incorporated the hamburger menu (Macy’s); the other did not (Best Buy).
With the Macy’s app, there was only one way to find the address: through the flyout menu launched by clicking the hamburger button. The Best Buy app had two potential paths: through a navigation bar in its “Stores” tab, or by hitting “Closest Store” and changing the zip code.
Even though Best Buy had two potential routes, both of which had fewer steps (if completed correctly) than Macy’s, people had a harder time doing the task on the Best Buy app. Best Buy saw an 83 percent completion rate, and Macy’s had a 96 percent success rate in the test. On the Best Buy app, users got lost quicker too. Only 57 percent took one of the first two intended steps, whereas 77 percent of users took the right first move on Macy’s.
Score a point for the hamburger.
Now, the purpose of the research wasn’t necessarily to settle the Great Hamburger Debate. (Whether to include one is considered situationally dependent.) It was to surface that kind of insight more quickly. User paths were aggregated into a flow diagram that made it clear where users either made progress or lost their way.
And all the information was easy to aggregate because researchers had automated logging for a slew of interactions — things like taps and pinch-zooms, plus screenshots of the action. The end result allowed researchers to not just identify UX trouble spots, but also find out why they were popping up.
How do you tie design to the outcomes you want?”
Years later, one of the researchers who led the study, Ranjitha Kumar, built upon those ideas at the popular usability-testing platform UserTesting, where she currently works as chief research scientist. The tool she spearheaded, released last October, similarly aggregates user paths and highlights standout patterns while also flagging notable outliers.
“My mandate is to bridge quantitative and qualitative experience testing,” Kumar told Built In.
Indeed, the platform centers on compiling user-interaction data at scale, then presenting it analytics dashboard-style.
This kind of user-behavioral insight is part of the evaluative side of the data-driven-design coin, meaning it turns to data to make sense of how users interact with a product or prototype. The other side is assistive, meaning data-driven models that help guide the design process with suggestions. The next step, of course, is what’s been called “agentive,” meaning that an AI does most of it, but that’s still pretty theoretical at this point.

Deeper Into Behavioral Analytics
“How do you tie design to the outcomes you want?”
That’s the driving question behind data-driven design, Kumar said. For some time, that basically just meant A/B testing. (The 2017 O’Reilly book Designing With Data is, in effect, an A/B explainer and guide.) Those kinds of comparative experiments are still valuable, but more recently, behavior analytics has opened up new possibilities.
Even those skeptical of the data-ization of design often admit that it plays an important role in understanding user behavior. The author of a popular 2019 Modus post called “Data-Driven Design Is Killing Our Instincts” nonetheless urged data analysis over opinion-gathering to understand user sentiment.
“When asked what they’ll do, customers will do what they think you want them to,” he wrote. “Instead, trust what they actually do when they think nobody’s looking.”
One of the most popular tools for knowing how people actually interact with a site is Hotjar. The company’s heatmaps let users see where visitors are clicking and scrolling on a site, and how much. The visualizations — little thermal globs that represent visitor interactions — let users get a sense of activity patterns at a glance.
Hotjar also offers users the ability to record visitor sessions. The videos capture where a user moves their mouse, clicks or scrolls. A progress bar at the bottom of the playback includes icons that show when those interactions occur, again allowing for a quick snapshot of activity. Video sessions can also be aggregated for bigger-picture analysis. It’s all very much a snapshot of what people “actually do.”
We want to see how people react to things before we actually write a single line of code.”
Getting this kind of in-the-wild understanding isn’t without challenges. Hotjar doesn’t work on mobile apps, for instance. Also, it only works on live sites, not prototypes — although that’s something Megan Murphy, vice president of product at Hotjar, is actively considering.
“When I think about the future, it’s hard not to notice the trends in low code and no code — the fact that it’s not just an engineering trend to make it easier to plug and play different components, but the same goes for UX designers or product managers,” Murphy said.
“We want to see how people react to things before we actually write a single line of code,” she added, noting the rise of companies like Maze and Figma.
Other challenges are less fundamental, more optimizational. For a long time, Hotjar users had to manually install the tracking code for each URL they wanted to track. Now, tracking a domain URL will also take care of that domain’s various paths. The change, launched in December, is “the biggest shift in the product since Hotjar launched, even though it’s not super visible throughout the experience,” Murphy said.
There’s also the psychological challenge. Is it all a bit ... creepy?
It should be noted that Hotjar doesn’t track users across sites or sell data, and it automatically anonymizes personally identifiable information (PII), “so that data containing PII never reaches Hotjar’s servers for heatmaps, recordings and incoming feedback,” according to the company’s site.
Murphy said the company has been proactive in terminating accounts that fail to maintain user consent standards.
“When our customers install tracking scripts [for] recordings and heatmaps, these two [features] cannot start capturing session data unless the end-most user has given their consent,” she said. “And in cases where we’ve had customers who have not abided by this, we have let go of those customers, because we don’t believe that our product should be misused in that way.”
Hotjar seems to enjoy good standing in the field in this regard. For instance, in a 2019 talk titled “Responsible Tracking: Learning From Your Users Without Being Creepy,” Kanopi Studios chief technical officer Katherine White approvingly noted Hotjar’s keystroke suppression and ability to let users opt out on Hotjar’s site. More generally, she ranked visual behavior analytics platforms that use heatmaps and session recordings lower on her “Creep-o-Meter” than Google Analytics.
There’s a broader implication of course. As the behavior-analytics subfield of data-driven design grows and more competitors emerge, striking the balance will continue to be critical across the board.
Machine Learning Systems of Support
As data-driven design matures in terms of evaluating user experiences, it’s simultaneously advancing when it comes to assisting in-process design work.
Consider Adobe Spark Post. The popular app is designed to let users easily make social graphics that actually look visually appealing, with a range of color palettes, animations, borders and layouts. Central to the app is its internal AI, dubbed Adobe Sensei.
For instance, if you upload multiple photos into Post’s collage function, it “knows” where to place each image, where to drop a text box and how to best crop images, if necessary, to make it as visually interesting as possible out of the gate. Adobe built the model in part by generating data from modifications to its tens of thousands of templates and crowdsourcing annotations that highlight important aspects of each design.
The appeal is obvious for non-designers who want to quickly make social posts that still look snappy, but it’s also helpful for pros, said Peter O’Donovan, senior computer scientist at Adobe. Systems that have some automated design suggestions let users “quickly prototype, get a mock-up” and, if desired, build out a finished design later in a professional tool, he said.
O’Donovan also recently helped develop a deep-learning model called the Unified Model of Saliency and Importance (UMSI), which learns to predict what elements within photos and graphic designs will grab viewers’ attention most. It’s not the same saliency model that’s used in Sensei, but it offers an interesting glimpse into the concept.
The research team used a data set of 1,000 images across five different classes — ads, infographics, mobile UIs, movie posters and web pages — plus photographs of natural images. The neural network learned each class’ patterns — information it could then use to predict visual importance in new designs.
The team also built a prototype design tool wherein the model gives feedback as users tweak elements in a design across the canvas. Users can adjust “importance scores,” and a back-end algorithm offers new variants based on those specifications.
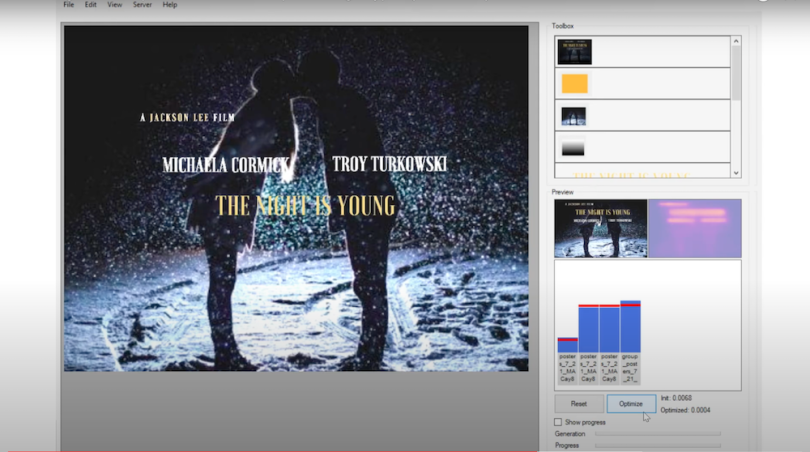
The tool is bare bones, but the proof of concept is there.
“The training procedure can be adapted, given a new training set, to any number of additional design classes,” researchers wrote. “This opens up the possibility of continually improving the current UMSI model to make it a one-stop shop for predicting attention on any images, natural and designed.”
UMSI is also in the same conceptual ballpark as DesignScape, a layout tool that O’Donovan built back in 2015 before joining Adobe. It used AI to suggest different placement options to avoid overlapping elements, while also offering responsive starting-point template designs.
Each is part of the larger data-driven push. The driving force, as Kumar said of her research, remains: “Can you generalize about design from a huge data set of design?”
When Do We Worry About the Rise of the UX Machines?
It seems a given that machine learning will only make further inroads into design, in both evaluative and assistive capacities. UserTesting, for example, introduced a sentiment-analysis feature last year that drops green and red icons into the playback bar of user-test videos to signal where positive and negative feedback was logged.
Elsewhere, researchers like Qian Yang are exploring AI as UX design material in healthtech, and, as Built In previously reported, Intuit’s tool to help users navigate the requirements for pandemic relief funds leveraged machine learning to personalize the interaction sequence for each user.
Of course, when the conversation turns to AI disruption, it’s easy to fret over the line between labor-saver and job-taker. Designers are no different. Murphy, for one, is surprisingly sanguine about the whole notion.
“I fully expect that my own job will be obsolete during my lifetime,” she said. “What would be my next act when product management itself changes beyond recognition, and it’s no longer interesting? I think that day will come.”
But as O’Donovan sees it, the complex nature of design means we’re essentially still feeling out which tasks make the best candidates either for automation or data-driven assistance.
“We’re really trying to understand the meat of what’s important in design, and some of those things are aided by data, and some aren’t,” he said.
“Building one data-driven model that will rule them all is, at the moment, not really tractable,” O’Donovan added.


