

DiagrammeR is a package in R that is used to create graphs and flowcharts using Graphviz and Mermaid. This can be useful for displaying data. In this article, we’ll cover how to create graphs using the grViz() in the DiagrammeR package, including:
- What is DiagrammeR?
- What is
grViz()in DiagrammeR? - How to create nodes, edges, labels and their substitution and connection using
grViz(). - How to render the plot graph with Knit to HTML.
What Is DiagrammeR?
DiagrammeR is a package within htmlwidgets for R. It’s used to generate graphs using Graphviz and Mermaid library.
How to Install DiagrammeR
In order to install DiagrammeR to create plot graphs, there are two steps. First, you’ll create an R Markdown document, which will set the output to HTML. Then, you’ll install the DiagrammeR package. Here’s how:
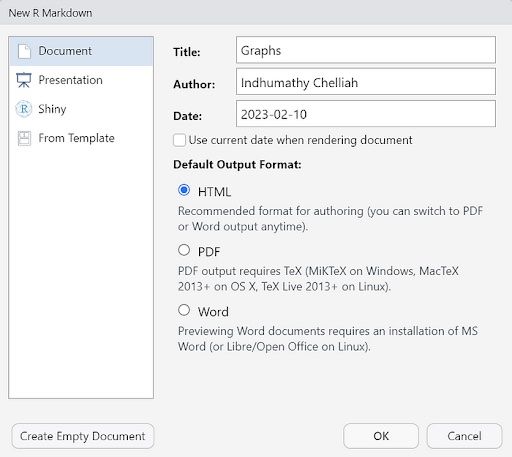
1. Create an R Markdown document.
In RStudio → Go to File → New File →R Markdown. Then, give the title and select the output format as HTML.
The R Markdown document will have the title and other information at the top.
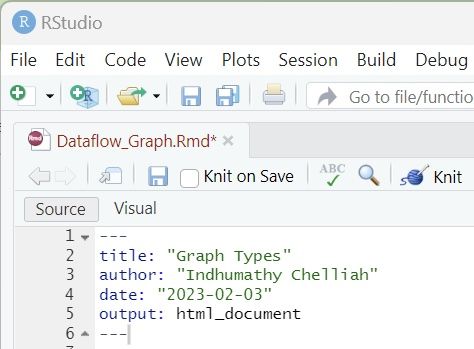
Below that we will have R chunks which have delimiters ```{r} and ```.
When you render the R Markdown document, it will run each chunk and embed the results beneath the code chunk or you can run each code chunk and the result will be displayed for that code chunk.
We can knit the R Markdown document to HTML output.
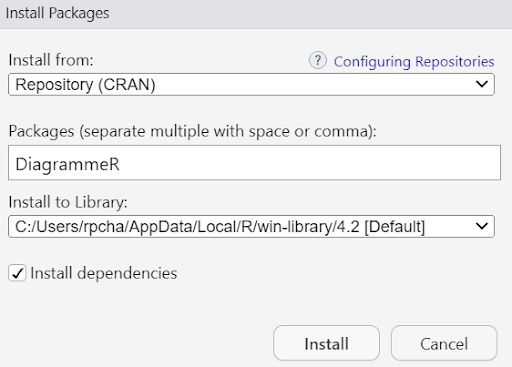
2. Install the DiagrammeR Package
Go to Packages → Install on the right side of the RStudio and enter the package name DiagrammeR and click “Install.”
And that’s it, you’ve installed DiagrammeR.
How to Create a Graph in DiagrammeR
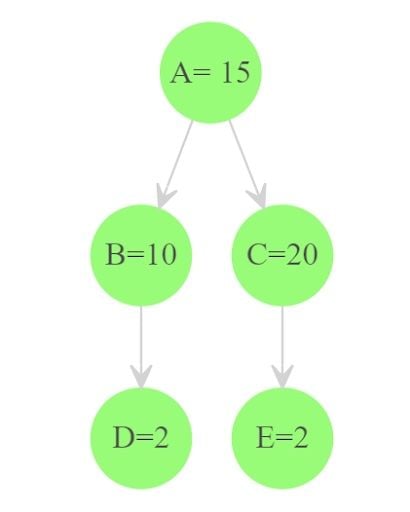
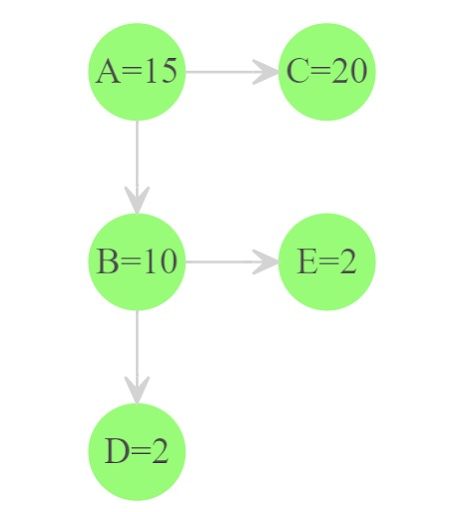
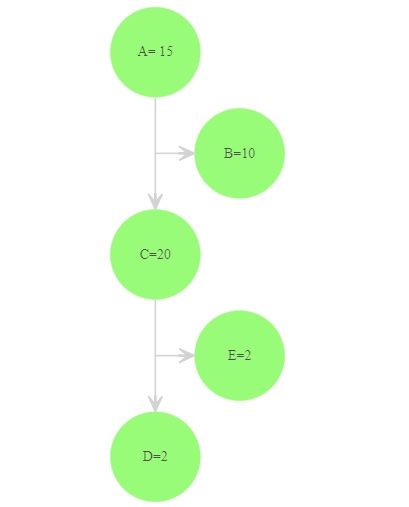
DiagrammeR package uses the grViz() function for Graphviz graphs. Let’s see how to use grViz() function to create graphs. While creating a graph, we have to mention the layout, node attributes, edge attributes and connection. In the graph below, green color circles are called nodes. A=15, B=10, etc. are the labels of the nodes.
The -> arrow mark is known as the edges. Here’s how to set the node, edge attributes, label and substitutions and connections required to create it.

5 Steps to Creating a Graph in DiagrammeR With grViz()
- Set the layout.
- Enter the node attributes.
- Enter the edge attributes.
- Enter the label and substitutions.
- Enter the connection details.
1. Set the Layout
The default layout is the dot.
layout = dot
2. Enter the Node Attributes
Include the node shape, color, style and width, etc. that you want for your graph.
node [shape = circle,color=green,style=filled,fixedsize=True,width=0.6]
3. Enter the Edge Attributes
Detail your edge attributes. These include color, arrowhead, arrow tail, pen width and direction, etc.
edge[color=grey,arrowhead=vee]
4. Enter the Label and Substitutions
We have to include the label and substitution for the node.
A[label = 'A= @@1']
B[label = 'B=@@2']
C[label = 'C=@@3']
D[label = 'D=@@4']
E[label = 'E=@@5']
@@1 -> is the substitution.
[1]:15
[2]:10
[3]:20
[4]:2
[5]:2
Here, 1 is the footnote number. The value 15 will be substituted in place of 1 when the graph is rendered.
5. Enter the Connection Details
In my graph A is connected to B and C. B is connected to D and C is connected to E.
A->B
A->C
B->D
C->E
Full R Code and Graph
```{r , echo=FALSE}
library(DiagrammeR)
grViz("
  digraph {
  layout = dot
    node [shape = circle,color=green,style=filled,fixedsize=True,width=0.6]
    edge[color=grey,arrowhead=vee]
    A[label = 'A= @@1']
    B[label = 'B=@@2']
    C[label = 'C=@@3']
    D[label = 'D=@@4']
    E[label = 'E=@@5']
    A->B
    A->C
    B->D
    C->E

  }
  [1]:15
  [2]:10
  [3]:20
  [4]:2
  [5]:2
   ")
Creating a Plot Graph Using DiagrammeR Example
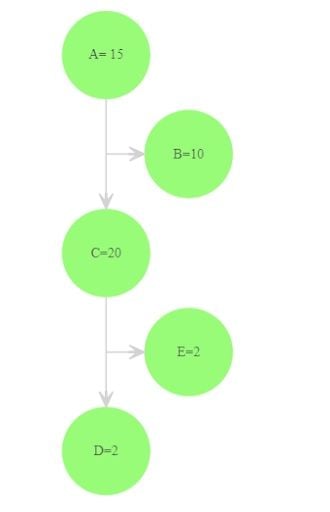
Let’s create another graph where nodes A and C are in the same rank and B, and E are in the same rank.
If we mention rank=same {A->C}, A and C nodes will be placed in the same line.
rank=same {A->C}

rank=same {B->E}
Full Code and Graph
```{r , echo=FALSE}
library(DiagrammeR)
grViz("
  digraph {
  layout = dot
    node [shape = circle,color=green,style=filled,fixedsize=True]
    edge[color=grey,arrowhead=vee,minlen = 1]
    A[label = 'A=@@1']
    B[label = 'B=@@2']
    C[label = 'C=@@3']
    D[label = 'D=@@4']
    E[label = 'E=@@5']
    A->B
    B->D
    edge [minlen = 2]
    rank=same {A->C}
    rank=same {B->E}

  }
  [1]:15
  [2]:10
  [3]:20
  [4]:2
  [5]:2
   ")
How to Add a Node to Your Plot Graph in DiagrammeR
Let’s create a node from the down arrow of another node.
Here’s how to create the graph mentioned above.
1. Create a Blank Node
First, we have to create a blank node.
A -> blank1;
blank1 -> B[minlen=10];
  {{ rank = same; blank1 B }}
blank1 -> C
C -> blank2;
blank2 -> D[minlen=1];
  {{ rank = same; blank2 E }}
blank2 -> E [minlen=10]
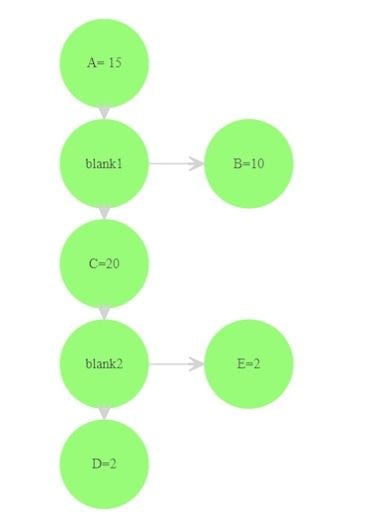
2. Create a blank Node Label
After that we can make the blank node label = “ “ and the width and height to be very small (0.01).
blank1[label = '', width = 0.01, height = 0.01]
blank2[label = '', width = 0.01, height = 0.01]
Full Code and Graph
```{r , echo=FALSE}
library(DiagrammeR)
grViz("
  digraph {
  layout = dot
    node [shape = circle,color=green,style=filled,fontsize=45,fixedsize=True,width=4.0]
    edge[color=grey,arrowhead=vee,penwidth=5,arrowsize=5]
    A[label = 'A= @@1']
    B[label = 'B=@@2']
    C[label = 'C=@@3']
    D[label = 'D=@@4']
    E[label = 'E=@@5']

blank1[label = '', width = 0.01, height = 0.01]
A -> blank1;
blank1 -> B[minlen=10];
  {{ rank = same; blank1 B }}
blank1 -> C
blank2[label = '', width = 0.01, height = 0.01]
C -> blank2;
blank2 -> D[minlen=1];
  {{ rank = same; blank2 E }}
blank2 -> E [minlen=10]

  }
  [1]:15
  [2]:10
  [3]:20
  [4]:2
  [5]:2
   ")
```
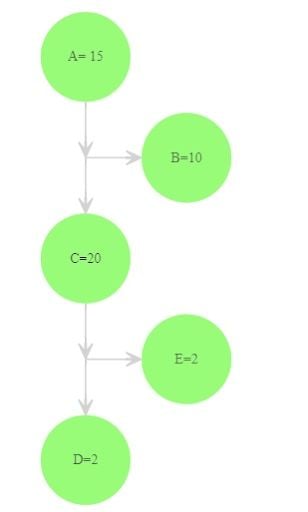
3. Remove the Arrow Mark
The next step is to remove the arrow mark. It can be removed by mentioning the edge attribute dir=none.
A -> blank1[dir=none];
C -> blank2[dir=none];
Full Code and Graph
```{r , echo=FALSE}
library(DiagrammeR)
grViz("
  digraph {
  layout = dot
    node [shape = circle,color=green,style=filled,fontsize=45,fixedsize=True,width=4.0]
    edge[color=grey,arrowhead=vee,penwidth=5,arrowsize=5]
    A[label = 'A= @@1']
    B[label = 'B=@@2']
    C[label = 'C=@@3']
    D[label = 'D=@@4']
    E[label = 'E=@@5']


blank1[label = '', width = 0.01, height = 0.01]
A -> blank1[dir=none];
blank1 -> B[minlen=10];
  {{ rank = same; blank1 B }}
blank1 -> C
blank2[label = '', width = 0.01, height = 0.01]
C -> blank2[dir=none];
blank2 -> D[minlen=1];
  {{ rank = same; blank2 E }}
blank2 -> E [minlen=10]

  }
  [1]:15
  [2]:10
  [3]:20
  [4]:2
  [5]:2
   ")
```
How to Render Your Plot Graph in DiagrammeR With Knit to HTML
Select the option knit -> knit to html.
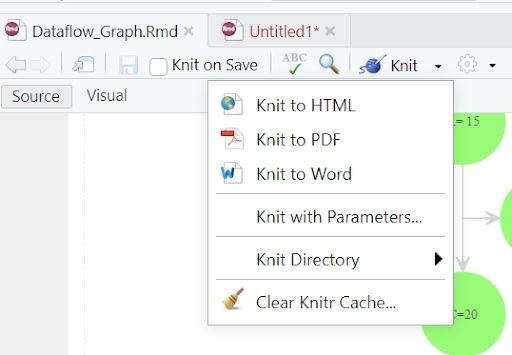
The whole R Markdown document will be rendered into an HTML document.
If you don’t want the r-code to be displayed in the HTML output, mention echo =False in the r-chunk code.
```{r , echo=FALSE}```
Advantages to Using DiagrammeR to Create Plot Graphs
DiagrammeR is a package in R that allows the creation of graphs using Graphviz and mermaid styles. In this article, we have covered using Graphviz style. We have covered how to create nodes, labels, edges, connections and layouts for the graphs using the grViz() function in the DiagrammeR package. We have also covered node attributes, edge attributes, labels and their substitutions. We have covered only the dot layout, which is the default layout in this article.


