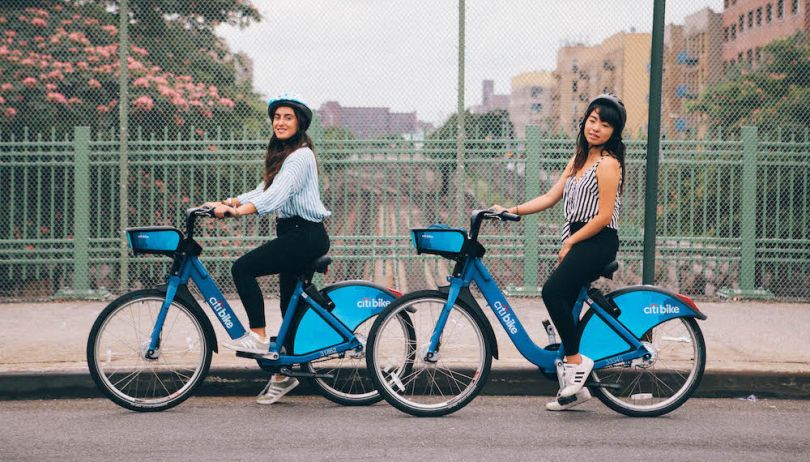
New York’s Upper West Side “drains” Citi Bikes.
That is, cyclists who have the option to rent bikes from — or return bikes to — docking stations located in the affluent Manhattan neighborhood, as part of the city’s bike-share program, tend to do a whole lot more renting than returning at those particular docks.
There are probably a number of reasons behind the Upper West Side’s persistent draining problem.
“One of them is likely that it’s uphill — and people don’t like to ride uphill,” said Laura Fox, Citi Bike general manager.
“Rebalancing is the hardest part of bike sharing.”
Elevation is one in an endless list of factors that influence bike-share user patterns, including time of day, day of week, location, weather and more. It’s this clown car of variables that makes the task of rebalancing — or moving bikes from crowded stations to empty, or less full, ones to optimize availability and drop-off — so complex.
“We joke internally that rebalancing is the hardest part of bike sharing,” she said. “It’s the part that makes the whole system work.”
It’s also something of a data-science rite of passage. Bootcamp curricula and Kaggle competition boards are littered with projects in which newcomers steer k-nearest neighbor algorithms, time series analysis and optimization models at the challenge. (They’re also popular, and possible, because bike-share companies are often laudably open with their data.)
Luckily, bike-share operators have had plenty of time to tackle the problem. Many are now seasoned veterans — Citi Bike was founded in 2013 — and have reams of historical data to inform and guide their rebalancing algorithms. That doesn’t mean hiccups never happen, but, after years of research, a strong operational baseline exists.
But what happens when the unprecedented hits? What if, say, there’s a dramatic surge in ridership after officials urge the public to avoid public transportation, if possible, due to a pandemic? And that’s followed by a dramatic plunge following a statewide stay-at-home order? And that’s followed by another jump, after lockdown restrictions begin to ease and the cooped up are itching to ride around. And countless other new variables emerge, like dozens of miles of road being restricted from vehicle through traffic, to promote social distancing. Suddenly all that historical data isn’t quite so applicable.

A Challenge Even in Normal Times
Before we answer that, it’s worth considering how complex bike rebalancing is at the core. The central challenge — determining how many bikes should be at a station at a given time — isn’t as simple as it seems at first blush.
One intuitive method that actually “fails badly” is to simply compare the net inflow and outflow at a station “that you get from your favorite demand estimation techniques,” said Daniel Freund, an assistant professor of operations management at the MIT Sloan School of Management who has led extensive data-driven rebalancing research.
Even before one considers questions like route optimization, or how best to map a bike-moving van or truck through a city, you need a sense of bike demand. “But even once you estimate demand, it’s not immediately clear how to go from the estimated demand to the actual number of bikes you want to have at the station,” he said.
He offered an illustrative hypothetical: Say that, at a given time, you can expect .5 bikes to leave a station per minute — which would lead you to believe the station should be completely filled whenever possible. “But the net flow doesn’t capture the full dynamics of the station,” he said.
Say the -.5 per minute figure consists of +2 (bike returns) and -2.5 (bike rentals). The rental demand is greater than the return volume, but the return is still rather high. A full station actually won’t work, since there’s a good chance the next customer is returning, rather than renting. That’s very different from, say, a .1 inflow to -.6 outflow ratio — the same net differential (-.5) but a far lower demand for returns. In the latter example, you can safely load up the racks whenever you stop by.
There’s also a layer on top of demand estimation — “everybody has what economists would call an externality in the system,” Freund said. That is, returning a bike is in a sense both supply and demand. “These externalities make it much more complicated,” he said. Another reason rebalancing is hard is because rebalancing is always just a drop in the bucket relative to total demand — the vast majority of the bikes that are moved are moved by the customer.”
Only once this challenge is cracked can you move onto the second key obstacle: What’s the most effective way to use one’s tools to actually redistribute the bikes? To be sure, these are all Day One problems, which have been largely refined by people like Freund and the algorithms employed by bike-share outfits. Still, they’re worth pointing out, if only to underscore the complexity of the operation.
Massive Shifts in Demand
But about that demand prediction during these volatile months?
“Trends have changed because commuting patterns are so different,” Fox said.
For one, evening Citi Bike trips have significantly risen. Typical patterns see 45 percent more evening trips than morning rides. Now that number is more than double. And, perhaps not surprisingly given the altered nature of work, there’s been a pronounced reverse in day-of-week patterns: Weekday rides used to outnumber weekend rides by about 10 percent. Now, there are 7 percent more weekend rides than weekday rides, in aggregate across the system.
“Trends have changed because commuting patterns are so different.”
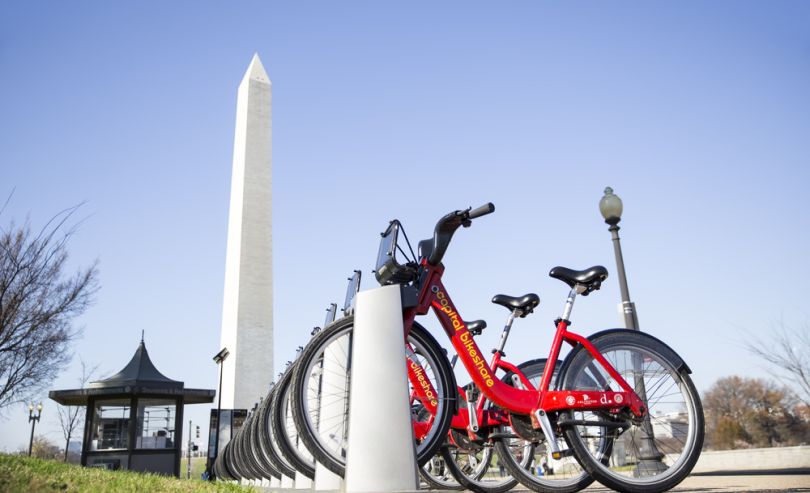
Another new wrinkle in the data? An influx of non-members using bike-share. Capital Bikeshare ridership, in Washington, D.C., is traditionally driven primarily by annual members, according to Chris Dattaro, general manager at the bike-share operator. But “we saw that trend shift dramatically, in pretty unprecedented rates,” he told Built In.
In March, only about about 25 percent of CaBi rides were non-member rides. That number climbed in April, then again in May, when, for the first time, non-member rides made up more than half of all CaBi rides in a month. It climbed higher still in June, to 55 percent. Why is that significant from a demand-prediction perspective? Uncertainty. Annual members’ rides are somewhat predictable; non-members, less so.
“For casual users, it was obviously much less about commuting and more about exploring the area or socially distanced transportation,” Darraro said.
There were other deviations from the norm too. Rides to a station adjacent to a grocery store in D.C. shot up 44 percent from pre-COVID levels, and stations near parks or leisure-friendly outdoor areas, like the National Mall, saw a whopping 92 percent increase in rides.

So How Do You Account for Such Volatility?
The algorithms at Citi Bike and Capital Bikeshare are pretty well-oiled. “We’re able to collect a lot of data, both historically and real time, which is the key to improving algorithms and machine learning,” said Dattaro (Capital is the oldest large-scale bike-share service in North America, which means a lot of historical data.) And it’s improved by splitting the data into several time slices — “we look at demand patterns by day of week, time of day, month of year,” he noted.
But all the unpredictability meant that some intervention was required, namely adjusting the weights. “Algorithms and rebalancing tools are based on historical data, so they go back a certain number of weeks,” Dattaro said. “But in order to account for new patterns, we cut that timeframe down pretty dramatically.”
The data team had to weigh the most recent week much more heavily than it normally would in order to have a better idea of how people were really using the system.
Indeed, Freund said modern rebalancing algorithms are robust enough to largely handle sudden, extreme demand shifts as long as weights are adjusted properly. That’s not to say riders don’t encounter trouble spots during unprecedented surges. In mid-March, before the stay-at-home order, riders in New York City reportedly took to social media after having difficulty finding places to dock.
“Now we have to look at outer-lying areas and areas around parks. It’s been drastically different.”
But proper weighing can rebound things quickly. “You just need to make sure that you don’t take the last two months of data as you estimate your demand — because two months ago, things were very different,” Freund said. “So you only look at the last two weeks, or maybe even only the last week.”
Freund said the only other major alteration a demand-prediction algorithm might need would be similar to how one would adjust to extreme weather. “If you’ve got a week of particularly strong thunderstorms in the middle of the summer in New York, which is clearly not unheard of, you’d want to adapt to that,” Freund said.
Giving extra weight to more recent historical data is more effective even than reacting to real-time information, according to experts. “Just saying, ‘Oh, people are riding in this park, go send the van out,’” is far less efficient than “seeing how people are using the system as a whole,” Dattaro said.
Indeed, even tracking GPS location of bikes — which neither bike-share system does — wouldn’t work as well, Freund noted. (Citi Bike has an opt-in setting that lets riders allow Citi Bike to record their anonymized route information, which it uses only in aggregate in order to improve the system.) By the time a rebalancing truck or van navigates through Manhattan and unloads bikes, any time information advantage GPS might have provided “really doesn’t buy you much,” Freund said.

The View on the Ground
So how does this all manifest on the streets? Shift scheduling has perhaps been impacted most. Mechanics and rebalancing crews worked primarily during the week, pre-pandemic; now, that’s shifted to weekends. “We’ve had to adjust our headcount to when people are coming in and when we’re deploying bikes and when we’re picking them up and when we’re rebalancing,” Dattaro said.
Also — no surprise — optimizing for the central business district is not so important these days.
“Now we have to look at outer-lying areas and areas around parks,” Dattaro said. “It’s been drastically different.
There has been one likely ameliorative factor: fewer rides overall, which may have made the act of rebalancing easier, if not necessarily demand prediction. In April, during the stay-at-home orders, Citi Bike’s average number of rides per day nosedived to 23,071, compared to 59,978 the same month in 2019 and 43,585 in 2018.
But even after restrictions eased and riders returned to the saddle, overall numbers lagged a bit. Both May and June saw year-over-year decreases in average rides per day compared to the previous two years, according to CitiBike data.
“Demand estimation is much harder in these volatile conditions” Freund said. “However, I imagine this could be alleviated by reduced stress on the system.”
There’s also less stress on the roads in general. Fewer cars makes for quicker routes. “With streets being empty, rebalancing has been very efficient,” Fox said.
With all these fluctuations in the new bike-share normal, the teams were hoping to also see a downtick in some of the traditional, neighborhood-based challenges. Like the Upper West Side’s penchant for “draining,” for example.
“Those problems still persisted, to our dismay,” Fox said. “People still don’t like riding uphill.”
Some patterns never change.
Note: An earlier version of this story stated that evening Citi Bike ridership had decreased as a proportion of total rides amid the pandemic. It has increased.


